XEI ETF provides exposure to large companies in Canada. It replicates the performance of the S&P/TSX Composite High Dividend Index, net of expenses.
The Index is comprised of 50 to 75 stocks from the S&P/TSX Composite Index focused on paying a monthly income.
This ETF rebalances itself quarterly. Each constituent is capped at 5% weight, while each sector is capped at 30% weight.
Pros of iShares XEI ETF
- It seeks to provide long-term capital growth.
- It pays monthly dividends.
- Low cost.
- It has an attractive yield.
Cons of iShares XEI ETF
- Not diversified geographically.
iShares XEI ETF Facts
- Inception Date: April 12, 2011
- Benchmark: S&P/TSX Composite High Dividend Index
- Net Assets: $1,099M
- MER: 0.22%
- 12 Month Trailing Yield: 4.10%
- Distribution Yield: 3.89%
- Dividend Schedule: Monthly
iShares XEI ETF MER – Management Expense Ratio
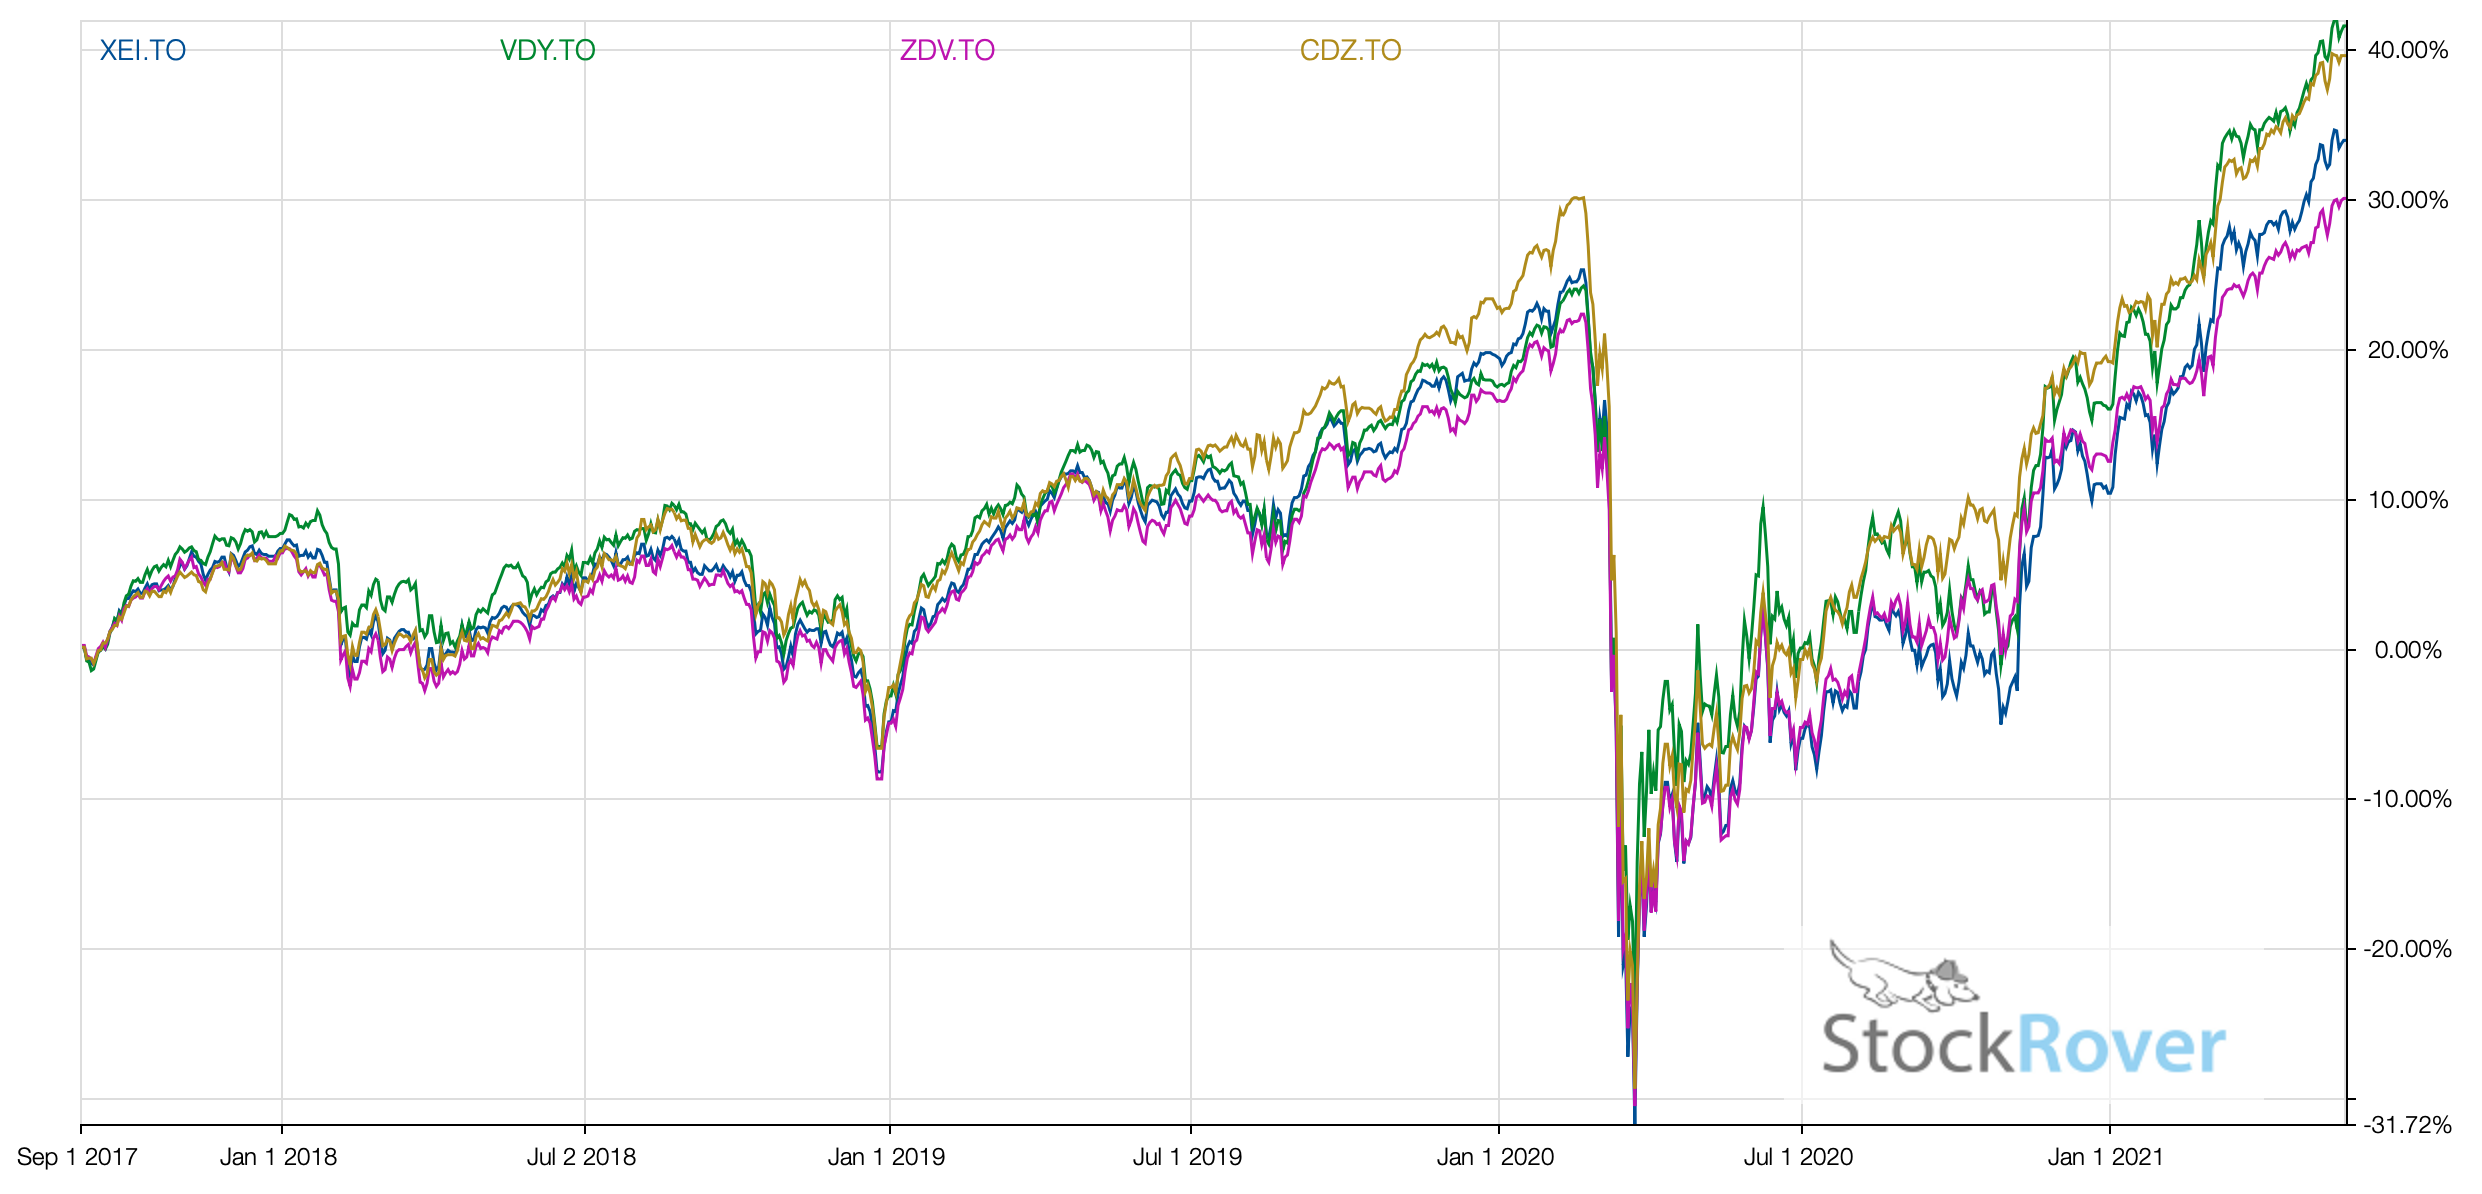
XEI’s management fee stands at 0.20% and MER is 0.22%. Its peers Vanguard VDY ETF and BMO ZDV ETF have an MER of 0.21% and 0.39% respectively.
The MER is what Blackrock takes to manage the fund for you. It’s much cheaper than mutual funds and in some cases cheaper than investing on your own.
Mutual funds can charge over 2% and it robs you of your returns. It’s time to ditch your mutual funds and switch to ETF ASAP. Many brokers such as Questrade or Qtrade offer free ETFs.
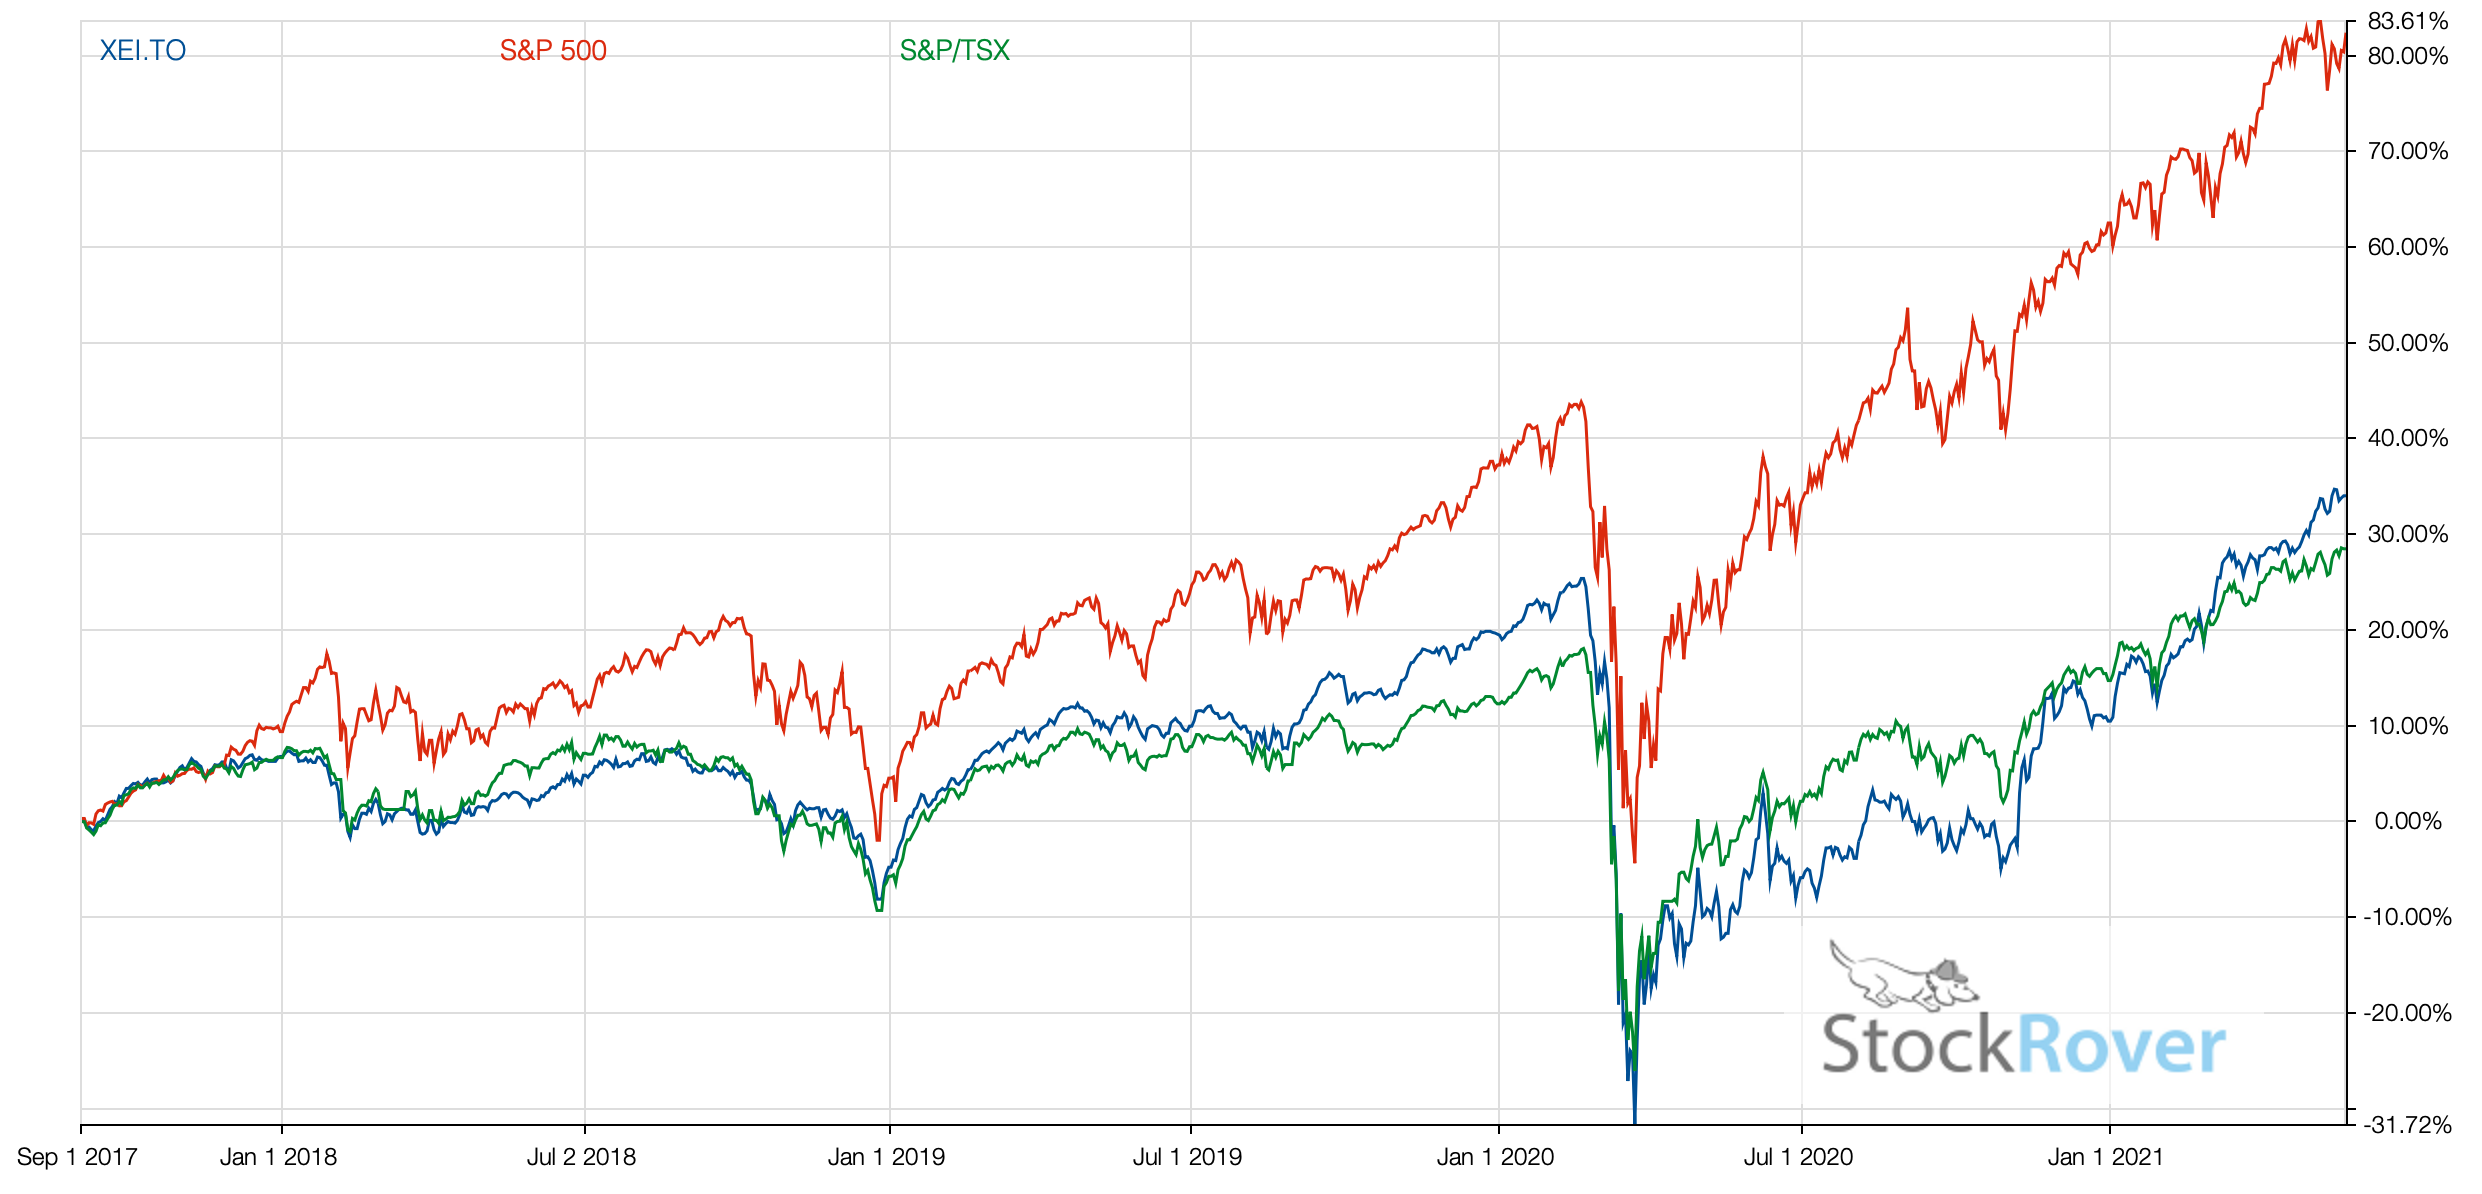
iShares XEI ETF Performance
The annual rate of return for iShares XEI ETF since inception is 6.20%. It has underperformed the broader S&P500 index.
The performance is acceptable for an income portfolio in “retirement” but not during the accumulation years. You leave way too much money on the table. The SP500 gives you twice that return.
Take your TFSA account as an example. The rules are the same for everyone and I mean everyone. The growth is ultimately a factor of your investment performance provided you make your TFSA contribution limit every year. The annual performance of an ETF matters as you can see below the growth over 20+ years.
| wdt_ID | Year | Yearly Limit | Cumulative | 5% Growth | 10% Growth | Dividend Earner | Spousal |
|---|---|---|---|---|---|---|---|
| 1 | 2009 | 5,000 | 5,000 | 5,250 | 5,500 | Not Tracked | Not Started |
| 2 | 2010 | 5,000 | 10,000 | 10,762 | 11,550 | Not Tracked | Not Started |
| 3 | 2011 | 5,000 | 15,000 | 16,550 | 18,205 | Not Tracked | Not Started |
| 4 | 2012 | 5,000 | 20,000 | 22,628 | 25,525 | Not Tracked | Not Started |
| 5 | 2013 | 5,500 | 25,500 | 29,534 | 34,128 | $41,742 | Not Started |
| 6 | 2014 | 5,500 | 31,000 | 36,786 | 43,590 | $52,820 | Not Started |
| 7 | 2015 | 10,000 | 41,000 | 49,125 | 58,949 | $56,307 | Not Started |
| 8 | 2016 | 5,500 | 46,500 | 57,356 | 70,984 | $70,200 | Not Started |
| 9 | 2017 | 5,500 | 52,000 | 65,999 | 84,034 | $78,900 | $13,308 |
| 10 | 2018 | 5,500 | 57,500 | 75,074 | 98,487 | $96,937 | $58,818 |
| 11 | 2019 | 6,000 | 63,500 | 85,128 | 114,986 | $129,467 | $82,596 |
| 12 | 2020 | 6,000 | 69,500 | 95,684 | 133,030 | $153,993 | $95,906 |
| 13 | 2021 | 6,000 | 75,500 | 106,769 | 152,933 | $181,601 | $113,194 |
| 14 | 2022 | 6,000 | 81,500 | 118,407 | 174,827 | $183,031 | $144,633 |
| 15 | 2023 | 6,500 | 88,000 | 131,152 | 199,459 | $223,557 | $166,695 |
| 16 | 2024 | 7,000 | 95,000 | 145,061 | 227,105 | $254,597 | $209,681 |
| 17 | 2025 | 7,000 | 102,000 | 159,664 | 257,516 | $250,284 YTD | $212,127 YTD |
| 18 | 2026 | 7,000 | 109,000 | 174,997 | 290,967 | ||
| 19 | 2027 | 7,000 | 116,000 | 191,097 | 327,764 | ||
| 20 | 2028 | 7,500 | 123,500 | 208,526 | 368,791 | ||
| 21 | 2029 | 7,500 | 131,000 | 226,828 | 413,920 | ||
| 22 | 2030 | 7,500 | 138,500 | 246,044 | 463,562 | ||
| 23 | 2031 | 7,500 | 146,000 | 266,221 | 518,168 | ||
| 24 | 2032 | 7,500 | 153,500 | 287,407 | 578,235 | ||
| 25 | 2033 | 7,500 | 161,000 | 309,653 | 644,308 | ||
| 26 | 2034 | 7,500 | 168,500 | 333,011 | 716,989 | ||
| 27 | 2035 | 7,500 | 176,000 | 357,536 | 796,938 | ||
| 28 | 2036 | 7,500 | 183,500 | 383,288 | 884,881 | ||
| 29 | 2037 | 7,500 | 191,000 | 410,327 | 981,620 | ||
| 30 | 2038 | 7,500 | 198,500 | 438,719 | 1,088,032 |
iShares XEI ETF Holdings
Investing in XEI is investing in the the Canadian stock market.
Below are the top holdings of XEI ETF at the time of writing. The ratio of weight can fluctuate on any month at the discretion of the fund manager in accordance with the fund target.
| TickerKey | Ticker | Company | Sector | Industry | Score | Quote | Market Cap | P/E | FPE | EPS | Yield | PayoutRatio | Payments | Dividend | Chowder | GrowthRating | IncomeRating | Tollbooth | Ambassador | Achiever | Aristocrat | King | Country | Graph | SectorID | IndustryID | Grade | MarketCapGroup |
|---|---|---|---|---|---|---|---|---|---|---|---|---|---|---|---|---|---|---|---|---|---|---|---|---|---|---|---|---|
| TSE:RY | RY | Royal Bank | Financial Services | Banks - Diversified | 55.95 | 177.48 | 250.30 | 14.13 | 14.13 | 12.56 | 3.4700 | 46.3600 | 4 | 6.16 | 10.0600 | 5 | 5 | Tollbooth - Unregulated | NO | YES | YES | NO | Canada | 1 | 7 | 21 | B | Mega Cap |
| TSE:TD | TD | TD Bank | Financial Services | Banks - Diversified | 60.79 | 100.09 | 172.40 | 10.38 | 10.38 | 9.64 | 4.2000 | 42.4100 | 4 | 4.20 | 11.3400 | 5 | 6 | Tollbooth - Unregulated | NO | YES | YES | NO | Canada | 1 | 7 | 21 | B | Large Cap |
| TSE:ENB | ENB | Enbridge | Energy | Oil & Gas Midstream | 53.75 | 63.73 | 138.93 | 22.44 | 22.44 | 2.84 | 5.9200 | 128.2100 | 4 | 3.77 | 9.0100 | 5 | 7 | Tollbooth - Unregulated | YES | YES | YES | NO | Canada | 1 | 5 | 71 | B | Large Cap |
| TSE:BMO | BMO | Bank of Montreal | Financial Services | Banks - Diversified | 57.82 | 152.92 | 110.42 | 14.23 | 14.23 | 10.75 | 4.2600 | 59.7200 | 4 | 6.52 | 11.3700 | 5 | 6 | Tollbooth - Unregulated | NO | YES | YES | NO | Canada | 1 | 7 | 21 | B | Large Cap |
| TSE:BNS | BNS | Scotia Bank | Financial Services | Banks - Diversified | 56.44 | 76.53 | 95.32 | 16.08 | 16.08 | 4.76 | 5.7500 | 86.6600 | 4 | 4.40 | 9.7200 | 5 | 7 | Tollbooth - Unregulated | NO | YES | YES | NO | Canada | 1 | 7 | 21 | B | Large Cap |
| TSE:CM | CM | CIBC | Financial Services | Banks - Diversified | 54.62 | 99.07 | 92.55 | 12.46 | 12.46 | 7.95 | 3.9200 | 47.7300 | 4 | 3.88 | 9.1800 | 5 | 6 | Tollbooth - Unregulated | NO | YES | YES | NO | Canada | 1 | 7 | 21 | B | Large Cap |
| TSE:CNQ | CNQ | Canadian Natural Resources | Energy | Oil & Gas E&P | 89.46 | 42.72 | 89.42 | 11.97 | 11.97 | 3.57 | 5.5000 | 59.8800 | 4 | 2.35 | 22.3600 | 9 | 8 | Intermediate | YES | YES | YES | NO | Canada | 1 | 5 | 69 | A+ | Large Cap |
| TSE:MFC | MFC | Manulife | Financial Services | Insurance - Life | 66.12 | 42.02 | 71.77 | 15.92 | 15.92 | 2.64 | 4.1900 | 60.4100 | 4 | 1.76 | 14.0400 | 6 | 6 | Tollbooth - Unregulated | YES | YES | YES | NO | Canada | 1 | 7 | 55 | A | Large Cap |
| TSE:TRP | TRP | TC Energy | Energy | Oil & Gas Midstream | 47.55 | 66.76 | 69.41 | 16.36 | 16.36 | 4.08 | 5.0900 | 88.2500 | 4 | 3.40 | 7.1800 | 2 | 7 | Tollbooth - Unregulated | NO | NO | YES | NO | Canada | 1 | 5 | 71 | C | Large Cap |
| TSE:SU | SU | Suncor | Energy | Oil & Gas Integrated | 64.81 | 53.86 | 66.12 | 11.17 | 11.17 | 4.82 | 4.2300 | 46.0400 | 4 | 2.28 | 9.8200 | 5 | 6 | Consumable - Necessities | NO | NO | NO | NO | Canada | 1 | 5 | 70 | B | Large Cap |
| TSE:IMO | IMO | Imperial Oil | Energy | Oil & Gas Integrated | 73.70 | 114.90 | 58.49 | 12.32 | 12.32 | 9.33 | 2.5100 | 25.9500 | 4 | 2.88 | 19.0300 | 8 | 5 | Consumable - Necessities | YES | YES | YES | NO | Canada | 1 | 5 | 70 | A | Large Cap |
| TSE:NA | NA | National Bank | Financial Services | Banks - Diversified | 53.72 | 143.40 | 56.12 | 13.67 | 13.67 | 10.49 | 3.2900 | 45.5800 | 4 | 4.72 | 11.9400 | 5 | 5 | Tollbooth - Unregulated | NO | YES | YES | NO | Canada | 1 | 7 | 21 | B | Large Cap |
| TSE:GWO | GWO | Great West Life | Financial Services | Insurance - Life | 71.68 | 52.06 | 48.45 | 12.67 | 12.67 | 4.11 | 4.6900 | 56.6500 | 4 | 2.44 | 10.7700 | 7 | 6 | Tollbooth - Unregulated | NO | YES | YES | NO | Canada | 1 | 7 | 55 | A | Large Cap |
| TSE:SLF | SLF | Sun Life Financial | Financial Services | Insurance - Diversified | 64.87 | 83.33 | 46.93 | 15.18 | 15.18 | 5.49 | 4.2200 | 60.4100 | 4 | 3.52 | 12.6700 | 6 | 6 | Tollbooth - Unregulated | NO | YES | YES | NO | Canada | 1 | 7 | 54 | B | Large Cap |
| TSE:NTR | NTR | Nutrien | Basic Materials | Agricultural Inputs | 42.37 | 80.77 | 39.37 | 54.93 | 54.93 | 1.47 | 3.7300 | 203.9800 | 4 | 2.18 | 6.6700 | 4 | 4 | Intermediate | NO | NO | YES | NO | Canada | 1 | 1 | 114 | C | Large Cap |
| TSE:POW | POW | Power Corporation | Financial Services | Insurance - Life | 57.15 | 55.96 | 35.92 | 13.45 | 13.45 | 4.16 | 4.3800 | 55.3600 | 4 | 2.45 | 11.2300 | 6 | 6 | Tollbooth - Unregulated | NO | YES | YES | NO | Canada | 1 | 7 | 55 | B | Large Cap |
| TSE:FTS | FTS | Fortis | Utilities | Utilities - Regulated Electric | 58.27 | 68.79 | 34.64 | 20.23 | 20.23 | 3.40 | 3.5800 | 47.4100 | 4 | 2.46 | 8.7500 | 6 | 6 | Tollbooth - Regulated | NO | YES | YES | NO | Canada | 1 | 12 | 106 | B | Large Cap |
| TSE:T | T | Telus | Communication Services | Telecommunication Services | 67.96 | 21.54 | 32.61 | 27.27 | 27.27 | 0.79 | 7.7300 | 135.2100 | 4 | 1.67 | 14.4200 | 8 | 1 | Tollbooth - Regulated | NO | YES | YES | NO | Canada | 1 | 2 | 99 | A | Large Cap |
| TSE:QSR | QSR | Restaurant Brands International | Consumer Cyclical | Restaurants | 49.84 | 93.86 | 30.75 | 22.99 | 22.99 | 4.08 | 3.6500 | 110.4500 | 4 | 2.48 | 6.2500 | 5 | 4 | Consumable - Discretionary | NO | NO | YES | NO | Canada | 1 | 3 | 87 | C | Large Cap |
| TSE:BCE | BCE | BCE | Communication Services | Telecommunication Services | 40.16 | 32.53 | 29.99 | 77.45 | 77.45 | 0.42 | 5.3800 | 620.4900 | 4 | 1.75 | 9.8400 | 3 | 6 | Tollbooth - Regulated | NO | NO | YES | NO | Canada | 1 | 2 | 99 | C | Large Cap |
| TSE:PPL | PPL | Pembina Pipeline | Energy | Oil & Gas Midstream | 54.39 | 51.32 | 29.81 | 16.72 | 16.72 | 3.07 | 5.5300 | 90.2000 | 4 | 2.84 | 8.3300 | 3 | 7 | Tollbooth - Unregulated | NO | NO | YES | NO | Canada | 1 | 5 | 71 | B | Large Cap |
| TSE:H | H | Hydro One | Utilities | Utilities - Regulated Electric | 51.74 | 49.66 | 29.78 | 24.34 | 24.34 | 2.04 | 2.6800 | 61.6700 | 4 | 1.33 | 8.0400 | 4 | 5 | Tollbooth - Regulated | NO | NO | YES | NO | Canada | 1 | 12 | 106 | B | Large Cap |
| TSE:RCI.B | RCI.B | Rogers | Communication Services | Telecommunication Services | 50.23 | 46.50 | 25.12 | 16.67 | 16.67 | 2.79 | 4.3000 | 48.6500 | 4 | 2.00 | 4.3000 | 3 | 7 | Tollbooth - Regulated | NO | NO | NO | NO | Canada | 1 | 2 | 99 | B | Large Cap |
| TSE:BIP.UN | BIP.UN | Brookfield Infrastructure Partners | Utilities | Utilities - Diversified | 47.22 | 42.91 | 19.93 | 562.81 | 562.81 | 0.08 | 5.5300 | 454.5700 | 4 | 1.72 | 15.2800 | 4 | 5 | Tollbooth - Regulated | NO | NO | NO | NO | Canada | 1 | 12 | 104 | C | Large Cap |
| TSE:EMA | EMA | Emera | Utilities | Utilities - Regulated Electric | 58.17 | 64.50 | 19.21 | 21.86 | 21.86 | 2.95 | 4.5000 | 65.4300 | 4 | 2.90 | 8.2700 | 5 | 7 | Tollbooth - Regulated | NO | YES | YES | NO | Canada | 1 | 12 | 106 | B | Large Cap |
| TSE:ARX | ARX | Arc Resources | Energy | Oil & Gas E&P | 52.37 | 27.35 | 15.93 | 10.77 | 10.77 | 2.54 | 2.7800 | 28.3900 | 4 | 0.76 | 2.7800 | 4 | 5 | Intermediate | NO | NO | NO | NO | Canada | 1 | 5 | 69 | B | Large Cap |
| TSE:WCP | WCP | Whitecap Resources | Energy | Oil & Gas E&P | 58.53 | 10.31 | 12.70 | 7.06 | 7.06 | 1.46 | 7.0800 | 51.7300 | 12 | 0.73 | 7.1200 | 4 | 9 | Intermediate | NO | NO | NO | NO | Canada | 1 | 5 | 69 | B | Large Cap |
| TSE:IAG | IAG | Industrial Alliance | Financial Services | Insurance - Diversified | 63.28 | 135.34 | 12.62 | 14.37 | 14.37 | 9.42 | 2.6600 | 39.2200 | 4 | 3.60 | 14.8900 | 6 | 4 | Tollbooth - Unregulated | YES | YES | YES | NO | Canada | 1 | 7 | 54 | B | Large Cap |
| TSE:ALA | ALA | AltaGas | Utilities | Utilities - Regulated Gas | 45.16 | 41.28 | 12.35 | 21.96 | 21.96 | 1.88 | 3.0500 | 65.0600 | 4 | 1.26 | 3.0500 | 4 | 5 | Tollbooth - Regulated | NO | NO | YES | NO | Canada | 1 | 12 | 107 | C | Large Cap |
| TSE:IGM | IGM | IGM Financial | Financial Services | Asset Management | 41.57 | 44.93 | 10.63 | 11.32 | 11.32 | 3.97 | 5.0100 | 56.5600 | 4 | 2.25 | 5.0100 | 1 | 7 | Consumable - Discretionary | NO | NO | NO | NO | Canada | 1 | 7 | 17 | C | Large Cap |
| TSE:CU | CU | Canadian Utilities | Utilities | Utilities - Diversified | 51.76 | 38.73 | 10.53 | 23.62 | 23.62 | 1.64 | 4.7300 | 109.3700 | 4 | 1.83 | 5.7300 | 4 | 7 | Tollbooth - Regulated | NO | YES | YES | NO | Canada | 1 | 12 | 104 | B | Large Cap |
| TSE:CHP.UN | CHP.UN | Choice Properties REIT | Real Estate | REIT - Retail | 38.10 | 14.19 | 10.27 | 0.00 | 0.00 | -0.17 | 5.4300 | 0.0000 | 12 | 0.77 | 5.9200 | 2 | 5 | Tollbooth - Unregulated | NO | NO | NO | NO | Canada | 1 | 10 | 84 | D | Large Cap |
| TSE:KEY | KEY | Keyera Corp | Energy | Oil & Gas Midstream | 57.74 | 43.67 | 10.01 | 18.35 | 18.35 | 2.38 | 4.7600 | 86.4500 | 4 | 2.08 | 6.7400 | 4 | 6 | Tollbooth - Unregulated | NO | NO | NO | NO | Canada | 1 | 5 | 71 | B | Large Cap |
| TSE:CPX | CPX | Capital Power Corporation | Utilities | Utilities - Independent Power Producers | 76.21 | 56.51 | 8.77 | 17.66 | 17.66 | 3.20 | 4.6100 | 69.6300 | 4 | 2.61 | 10.7400 | 7 | 7 | Tollbooth - Unregulated | NO | YES | YES | NO | Canada | 1 | 12 | 105 | A | Mid Cap |
| TSE:BTO | BTO | B2Gold | Basic Materials | Gold | 44.05 | 4.74 | 6.26 | 0.00 | 0.00 | -0.64 | 2.3300 | 0.0000 | 4 | 0.08 | 154.3100 | 4 | 5 | Intermediate | NO | NO | NO | NO | Canada | 1 | 1 | 46 | C | Mid Cap |
| TSE:AQN | AQN | Algonquin Power & Utilities Corp | Utilities | Utilities - Renewable | 44.00 | 8.14 | 6.25 | 0.00 | 0.00 | -2.10 | 4.4100 | 0.0000 | 4 | 0.26 | 13.5600 | 3 | 7 | Tollbooth - Unregulated | NO | NO | NO | NO | Canada | 1 | 12 | 109 | C | Mid Cap |
| TSE:ACO.X | ACO.X | Atco | Utilities | Utilities - Diversified | 58.60 | 50.89 | 5.73 | 13.02 | 13.02 | 3.91 | 3.9700 | 50.8000 | 4 | 2.02 | 6.9600 | 4 | 6 | Tollbooth - Regulated | NO | YES | YES | NO | Canada | 1 | 12 | 104 | B | Mid Cap |
| TSE:REI.UN | REI.UN | RioCan | Real Estate | REIT - Retail | 45.75 | 17.57 | 5.21 | 20.20 | 20.20 | 0.87 | 6.5900 | 128.1500 | 12 | 1.16 | 6.5900 | 2 | 6 | Tollbooth - Unregulated | NO | NO | NO | NO | Canada | 1 | 10 | 84 | C | Mid Cap |
| TSE:CSH.UN | CSH.UN | Chartwell Retirement Residences | Real Estate | REIT - Healthcare Facilities | 27.30 | 17.69 | 4.97 | 84.61 | 84.61 | 0.21 | 3.4600 | 207.2500 | 12 | 0.61 | 3.5700 | 1 | 4 | Tollbooth - Unregulated | NO | NO | NO | NO | Canada | 1 | 10 | 80 | D | Mid Cap |
| TSE:CIX | CIX | CI Financial | Financial Services | Asset Management | 19.21 | 31.96 | 4.58 | 0.00 | 0.00 | -1.85 | 2.5000 | 0.0000 | 4 | 0.80 | 2.5000 | 1 | 5 | Consumable - Discretionary | NO | NO | NO | NO | Canada | 1 | 7 | 17 | D | Mid Cap |
| TSE:GRT.UN | GRT.UN | Granite REIT | Real Estate | REIT - Industrial | 58.40 | 73.84 | 4.50 | 14.75 | 14.75 | 5.01 | 4.6000 | 66.1600 | 12 | 3.40 | 7.8200 | 6 | 4 | Tollbooth - Unregulated | NO | YES | YES | NO | Canada | 1 | 10 | 81 | B | Mid Cap |
| TSE:SRU.UN | SRU.UN | SmartCentres REIT | Real Estate | REIT - Retail | 47.19 | 25.40 | 4.33 | 18.01 | 18.01 | 1.41 | 7.2800 | 108.7300 | 12 | 1.85 | 7.2800 | 2 | 6 | Tollbooth - Unregulated | NO | NO | NO | NO | Canada | 1 | 10 | 84 | C | Mid Cap |
| TSE:GEI | GEI | Gibson Energy | Energy | Oil & Gas Midstream | 52.36 | 25.14 | 4.12 | 25.92 | 25.92 | 0.97 | 6.8400 | 170.2000 | 4 | 1.72 | 10.0100 | 6 | 8 | Tollbooth - Unregulated | NO | NO | YES | NO | Canada | 1 | 5 | 71 | B | Mid Cap |
| TSE:CRT.UN | CRT.UN | CT REIT | Real Estate | REIT - Retail | 63.14 | 15.39 | 3.65 | 10.23 | 10.23 | 1.51 | 6.1600 | 45.2000 | 12 | 0.95 | 9.6100 | 5 | 6 | Tollbooth - Unregulated | NO | YES | YES | NO | Canada | 1 | 10 | 84 | B | Mid Cap |
| TSE:EIF | EIF | Exchange Income Fund | Industrials | Airlines | 50.54 | 65.99 | 3.39 | 26.72 | 26.72 | 2.47 | 4.0000 | 103.5100 | 12 | 2.64 | 7.4600 | 5 | 7 | Consumable - Discretionary | NO | NO | YES | NO | Canada | 1 | 9 | 14 | B | Mid Cap |
| TSE:DIR.UN | DIR.UN | Dream Industrial | Real Estate | REIT - Industrial | 52.36 | 11.51 | 3.35 | 14.46 | 14.46 | 0.80 | 6.0800 | 61.0800 | 12 | 0.70 | 6.0800 | 3 | 5 | Tollbooth - Unregulated | NO | NO | NO | NO | Canada | 1 | 10 | 81 | B | Mid Cap |
| TSE:HR.UN | HR.UN | H&R REIT | Real Estate | REIT - Diversified | 29.00 | 11.54 | 3.03 | 0.00 | 0.00 | -0.78 | 5.2000 | 0.0000 | 12 | 0.60 | 5.2000 | 1 | 5 | Tollbooth - Unregulated | NO | NO | NO | NO | Canada | 1 | 10 | 120 | D | Mid Cap |
| TSE:CRR.UN | CRR.UN | Crombie REIT | Real Estate | REIT - Diversified | 36.90 | 14.35 | 2.65 | 0.00 | 0.00 | -0.05 | 6.2000 | 79.4000 | 12 | 0.89 | 6.2000 | 2 | 6 | Tollbooth - Unregulated | NO | NO | NO | NO | Canada | 1 | 10 | 120 | D | Mid Cap |
| TSE:RUS | RUS | Russel Metals | Industrials | Industrial Distribution | 44.98 | 43.73 | 2.47 | 16.50 | 16.50 | 2.65 | 3.9300 | 63.1200 | 4 | 1.72 | 5.2300 | 2 | 6 | Intermediate | NO | NO | NO | NO | Canada | 1 | 9 | 52 | C | Mid Cap |
| TSE:AP.UN | AP.UN | Allied Properties REIT | Real Estate | REIT - Office | 39.20 | 17.08 | 2.39 | 0.00 | 0.00 | -3.97 | 10.5400 | 0.0000 | 12 | 1.80 | 12.4500 | 3 | 9 | Tollbooth - Unregulated | NO | NO | YES | NO | Canada | 1 | 10 | 82 | D | Mid Cap |
| TSE:NWC | NWC | The North West Company | Consumer Defensive | Grocery Stores | 59.33 | 47.19 | 2.26 | 16.67 | 16.67 | 2.83 | 3.3900 | 55.2800 | 4 | 1.60 | 6.8900 | 5 | 5 | Consumable - Necessities | NO | YES | YES | NO | Canada | 1 | 4 | 47 | B | Mid Cap |
| TSE:NFI | NFI | NFI Group | Consumer Cyclical | Auto Manufacturers | 19.63 | 18.69 | 2.23 | 0.00 | 0.00 | -1.89 | 0.0000 | 0.0000 | 0 | 0.00 | 0.0000 | 1 | 2 | Durable | NO | NO | NO | NO | Canada | 1 | 3 | 18 | D | Mid Cap |
| TSE:KMP.UN | KMP.UN | Killam Apartment REIT | Real Estate | REIT - Residential | 47.22 | 18.17 | 2.18 | 3.38 | 3.38 | 5.37 | 3.9600 | 9.5400 | 12 | 0.72 | 4.7600 | 3 | 4 | Tollbooth - Unregulated | NO | NO | YES | NO | Canada | 1 | 10 | 83 | C | Mid Cap |
| TSE:WTE | WTE | Westshore Terminals | Industrials | Marine Shipping | 47.61 | 28.28 | 1.75 | 15.62 | 15.62 | 1.81 | 5.3000 | 103.0200 | 4 | 1.50 | 6.5900 | 3 | 8 | Intermediate | NO | NO | NO | NO | Canada | 1 | 9 | 118 | C | Small Cap |
| TSE:LIF | LIF | Labrador Iron Ore Royalty | Basic Materials | Steel | 44.60 | 26.49 | 1.70 | 12.44 | 12.44 | 2.13 | 7.5500 | 140.0100 | 4 | 2.00 | 7.5500 | 1 | 8 | Intermediate | NO | NO | NO | NO | Canada | 1 | 1 | 97 | C | Small Cap |
| TSE:SIA | SIA | Sienna Senior Living | Healthcare | Medical Care Facilities | 40.98 | 17.92 | 1.65 | 43.71 | 43.71 | 0.41 | 5.2200 | 200.9200 | 12 | 0.94 | 5.2200 | 3 | 6 | Tollbooth - Unregulated | NO | NO | NO | NO | Canada | 1 | 8 | 113 | C | Small Cap |
| TSE:TCL.A | TCL.A | Transcontinental | Industrials | Specialty Business Services | 45.69 | 19.21 | 1.61 | 9.06 | 9.06 | 2.12 | 4.6900 | 88.2800 | 4 | 0.90 | 4.6900 | 1 | 7 | Intermediate | NO | NO | NO | NO | Canada | 1 | 9 | 92 | C | Small Cap |
| TSE:SPB | SPB | Superior Plus | Utilities | Utilities - Regulated Gas | 29.32 | 6.90 | 1.60 | 45.19 | 45.19 | 0.15 | 2.6100 | 398.6800 | 4 | 0.18 | 2.6100 | 1 | 3 | Tollbooth - Regulated | NO | NO | NO | NO | Canada | 1 | 12 | 107 | D | Small Cap |
| TSE:LB | LB | Laurentian Bank | Financial Services | Banks - Regional | 46.88 | 30.51 | 1.35 | 10.17 | 10.17 | 3.00 | 6.1600 | 58.7600 | 4 | 1.88 | 6.1600 | 1 | 8 | Tollbooth - Unregulated | NO | NO | NO | NO | Canada | 1 | 7 | 22 | C | Small Cap |
| TSE:ARE | ARE | Aecon Group | Industrials | Engineering & Construction | 40.91 | 19.34 | 1.22 | 56.88 | 56.88 | 0.34 | 3.9300 | 190.9800 | 4 | 0.76 | 6.7100 | 3 | 6 | Durable | NO | NO | YES | NO | Canada | 1 | 9 | 38 | C | Small Cap |
| TSE:NWH.UN | NWH.UN | Northwest Healthcare Properties REIT | Real Estate | REIT - Healthcare Facilities | 48.24 | 4.77 | 1.18 | 0.00 | 0.00 | -1.03 | 7.5500 | 0.0000 | 12 | 0.36 | 7.5500 | 3 | 7 | Tollbooth - Unregulated | NO | NO | NO | NO | Canada | 1 | 10 | 80 | C | Small Cap |
| TSE:MTL | MTL | Mullen Group | Energy | Oil & Gas Equipment & Services | 59.65 | 13.07 | 1.14 | 11.88 | 11.88 | 1.10 | 6.4300 | 71.4800 | 12 | 0.84 | 6.4300 | 4 | 8 | Intermediate | NO | NO | NO | NO | Canada | 1 | 5 | 115 | B | Small Cap |
| TSE:AX.UN | AX.UN | Artis REIT | Real Estate | REIT - Diversified | 30.68 | 7.38 | 0.72 | 0.00 | 0.00 | -0.40 | 8.1300 | 0.0000 | 12 | 0.60 | 8.1300 | 2 | 7 | Tollbooth - Unregulated | NO | NO | NO | NO | Canada | 1 | 10 | 120 | D | Small Cap |
| TSE:D.UN | D.UN | Dream Office REIT | Real Estate | REIT - Office | 31.56 | 16.42 | 0.27 | 0.00 | 0.00 | -6.02 | 6.0900 | 0.0000 | 12 | 1.00 | 6.0900 | 1 | 5 | Tollbooth - Unregulated | NO | NO | NO | NO | Canada | 1 | 10 | 82 | D | Micro Cap |
| TSE:CJR.B | CJR.B | Corus Entertainment | Communication Services | Entertainment | 15.58 | 0.10 | 0.02 | 0.00 | 0.00 | -0.39 | 0.0000 | 0.0000 | 4 | 0.00 | 0.0000 | 0 | 2 | Tollbooth - Unregulated | NO | NO | NO | NO | Canada | 1 | 2 | 39 | D | Micro Cap |
XEI focuses on established, profitable companies with long dividend track records. Some of its top holdings include leading Canadian names like Toronto Dominion, Royal Bank of Canada, TC Energy, BCE, etc. Toronto Dominion is its most significant holding with a ~5% weightage, followed by RBC with another 5% allocation.
TC Energy is its third-largest holding, accounting for ~4.9% of iShares XEI’s fund allocation. XEI is a good way of investing in the large-cap companies, listed on the TSX, and paying regular dividends.
iShares XEI ETF Sector Allocation
iShares XEI is diversified by sectors. The ETF is majorly inclined towards the Energy, Financials, and Communication sectors with a weightage of ~30%, ~30%, and ~13%, respectively. It also provides investors with exposure to utilities (~11%) and materials (~6%), and the balance of 10% towards consumer cyclical, healthcare, and industrials companies. So, the highest allocation is towards energy and the lowest weightage is in the healthcare sectors. However, these allocations may change from time to time.
| wdt_ID | Sector | Ratio |
|---|---|---|
| 1 | Financials | 30.01 |
| 2 | Utilities | 10.95 |
| 3 | Communication Services | 12.92 |
| 4 | Consumer Cyclical | 2.68 |
| 5 | Energy | 29.68 |
| 6 | Basic Materials | 6.11 |
| 7 | ||
| 8 | Industrials | 1.04 |
| 9 | Consumer Defensive | 0.19 |
| 10 | Real Estate | 5.72 |
| 11 | Cash | 0.29 |
| 12 | Technology | 10.37 |
| 13 | Healthcare | 0.42 |
Why hold iShares XEI ETF
XEI ETF is similar to many other ETFs and dividend ETFs that are broadly following the TSX. In the end, you want to focus on the lower fees and the more consistent yield.
I must admit that I see it as only an income investment in retirement.
If you want the dividends, it’s not clear you will get the same growth but the the best banks and the best utility stocks will give you more income.