Start Tracking Your Portfolio
Tired of looking into multiple locations to see your dividend income or portfolio performance?
Forget paying $20 per month when you can do the same with a Google Sheet.
With 1 spreadsheet, you can do it all in one place and get a clear picture.
- Track your portfolio holdings by accounts and across accounts.
- Visualize your diversification.
- Categorize your holdings by dividend yield and dividend growth.
- Track your dividend income by month.
Plus, you’ll be in full control!
PORTFOLIO TRACKER
$39
Portfolio Performance
Dividend Income
Diversification Graph
Stock Exposure
Google Account
Requirements
A Google Sheet account.
Willingness to update the necessary data (number of stocks, transactions and dividends) to get a clear picture or your performance.
What You Need To Do
In the section below you can see a preview of each of the tabs but as an investor you are expected to do the following on a regular basis:
- Enter every transactions when they occur.
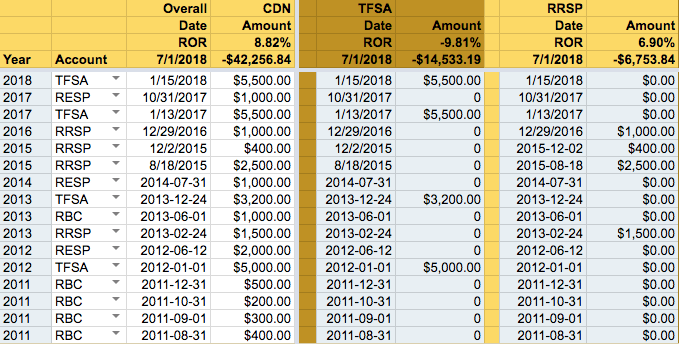
- Enter the contributions to your account – that’s a deposit to your account. It’s used to calculate the true rate of return.
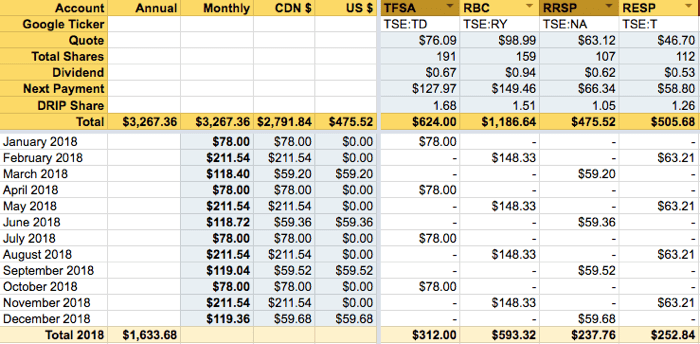
- Enter the dividends earned every month. Yes, it’s manual simply because there are no central systems outside the discount broker platforms that can provide reliable information.It’s important to understand your expectations in order to get a clear picture of your portfolio.
Often times, families have accounts in multiple locations and this extra work allow families to see the full picture.
Portfolio Tracker Overview
Summary View
Get a bird’s eye view of your portfolio, the performance, and status towards your goals.
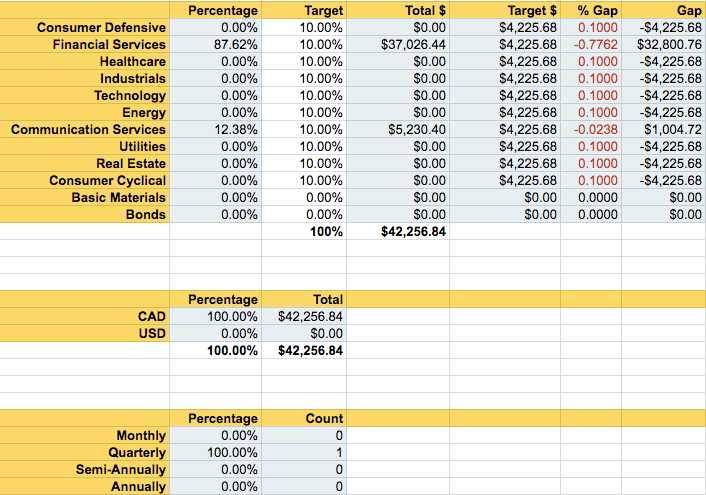
Sector & Industry Diversification
Know your exposure to the different sectors and use it to make investment decisions.
Portfolio & Account Performance
Get a clear annual rate of return on your portfolio and accounts.
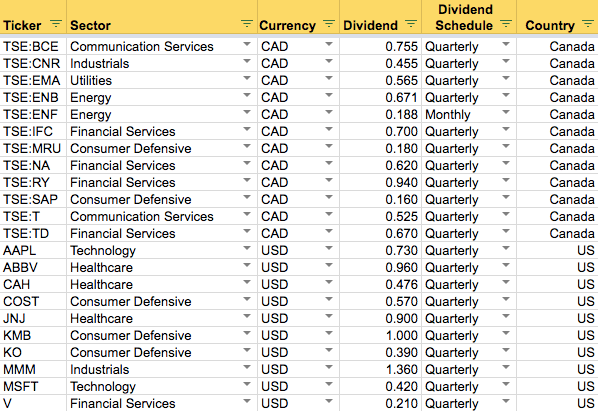
Stock Details
Know your holdings by tracking many data points per stock including the account, the sector, the dividend, the amount invested and the market value.
Dividend Income
Track your dividend income per stock, per account and for your portfolio.
Stock Exposure
See how much you are exposed to your holdings across all of your accounts.
Knowing where you have been is critical. Once you know, you can take the necessary steps to reach your retirement and financial freedom goals. Until then, it’s all guess work.
Summary View
The summary is broken down into your performance, your dividend income and your contribution. Ensure your ROR matches your goals for growth and always aspire to contribute more every year. The more you earn from your employment, the more you should be investing.


Sector & Industry Diversification
Know your exposure to the different sectors and use it to make investment decisions.

Portfolio & Account Performance
Tracking the performance of a portfolio is not easy.
It’s not as simple as seeing a stock up 50%. 50% over 10 years is not much to be desired … What was the annual return? Proper calculations require contribution date and amount contributed.
With the annual Rate of Return (ROR), you can then properly see how your portfolio is doing and take action.

Stock Details
The data is broken down into a summary, performance, tax accounting and dividend. When we look at a stock holding, we want to know where it’s at, if it’s up or down, our potential capital gains if we sell and the dividend it pays.

Dividend Income
With a detailed monthly breakdown of dividend, you can assess the income for your needs or the potential growth of your portfolio.

Stock Exposure
See how your holdings overlap across your accounts.

Be in Charge – 8 Simple Steps
Choose your primary currency (usually CAD or USD)
List your accounts
List the sectors you track.
Enter your stock tickers and quotes.
Enter your holdings details.
Enter your diversification targets.
Enter your contributions to each of the accounts.
PORTFOLIO TRACKER
$39
Portfolio Performance
Dividend Income
Diversification Graph
Stock Exposure
Google Account