Do you have a designated retirement figure? I have mine, and it amounts to $1,777,777. You can readily determine your retirement number as well by simply inputting a few figures to ascertain your objective.
Although it may appear to be a substantial amount, it becomes less daunting when approached with systematic planning. You may be curious about the calculation method employed to arrive at this figure, which is quite straightforward. By working backwards from the desired annual amount and engaging in basic mathematical computations, you can establish your retirement number.
Calculating Your Retirement Number
A dividend investor will do a calculation based on the income their dividends can generate before tax while other investors may need to have a fancier calculator to estimate growth and withdrawal.
- The dividend income approach has three variables needing to be answered and since we are looking for the total amount for your portfolio, you need to provide the yield and the income you need. Provided that, you can have your number.
- The withdrawal approach needs to have a growth parameter, a withdrawal rate, and a time horizon.
The retirement number I aim for, during the enjoyable retirement period focused on travel and dining out, is $70,000. This assumes that housing expenses have been fully covered. To reach this goal, I anticipate targeting a dividend yield of 4.0%, which will generate the desired $70,000. Alternatively, a dividend yield of 3.5% would cover $60,000. These targets are attainable through the use of dividend stocks in the retirement model portfolio.
To determine your portfolio retirement number, divide the desired income by the yield. It’s very simple math as long as your dividend is never dropping and the companies stay in business. As such, large cap blue-chip stocks are usually preferred for this retirement strategy. The simplicity and safety of capital is what draws investors to it.
Regarding inflation concerns, the income from the portfolio will experience annual growth through dividend increases, effectively keeping pace with inflation, or so it should if you select the proper stocks which means no REITs. This concept has been proven successful in my current portfolio, eliminating any worries about inflation.
It is important to note that the aforementioned figures do not include any potential income from the Canadian government, such as Old Age Security (OAS) or the Canada Pension Plan (CPP). Although most retirees should receive CPP payments, the exact amount is currently unknown, just as it is for OAS payments.
Reaching the Magic Number
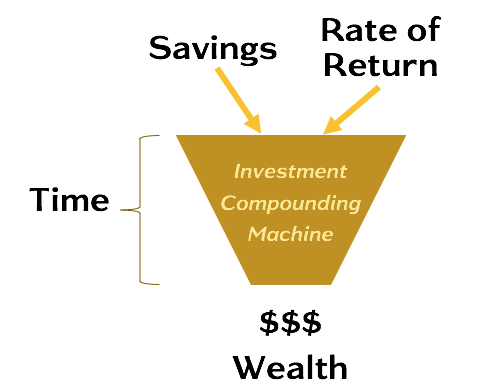
Achieving your retirement goal is about having a plan. You can assess if the number is within reach by using historical growth rate along with your savings and rate of return.
I use the Rule of 72 to assess my trajectory. The Rule of 72 tells you the number of years needed to double your money based on a rate of return. Try to use a rate of return since inception or at least 5 years so it’s not scewed by the last year of the market.
My portfolio rate of return is over 11.00% and has fluctuated between 10.00% and 14.00% and has rarely gone below 10.00% since 2009. Using 10% ROR, I would double my money in 7.2 years. To select solid blue-chip stocks with a strong dividend growth, I leverage the Chowder Score to make my selection, and also take advantage of many US mega-cap dividend growth stocks.
Below are the 3 components of wealth building. Simple, isn’t it? The rate of return is the most difficult to control but I can tell you that I beat the index since 2009.

The Path to Retirement
09As you know, my current portfolio is built for growth and not for retirement income. Once my magic number is reached, my portfolio needs to transform itself from a 2.0% dividend yield to a 4.0% dividend yield, or use a hybrid income plus withdrawal approach.
The initial path to retirement is to build a nest egg large enough, and it’s not about focusing on the income. Many investors build the wrong portfolio at the wrong time and do not understand the money left on the table and impact on time to reach the goal.

Stagnating stocks with a 4% yield are not helping the goal of building a large portfolio in a decent timeline. Those investments requires working for much longer. As such, dividend growth stocks with low yield are usually better suited.
Interestingly, new products are always created to help, or confuse, investors. One of those products is covered call ETFs which when properly used, can provide an additional income to boost your income. Covered calls are not the same as other options and many investors use them to create more income from the steady portfolio. So why not leverage experts in the field. This covered call strategy is being assessed with the corporate portfolio.
| wdt_ID | Year | CAD Dividends | USD Dvidends | Gross Annual Dividend | Gross Monthly Income | Annual Dividend Growth |
|---|---|---|---|---|---|---|
| 1 | 2010 | 3,785 | 0 | 3,785 | 315 | |
| 2 | 2011 | 4,674 | 68 | 4,742 | 395 | 25.28 |
| 3 | 2012 | 5,579 | 177 | 5,756 | 480 | 19.14 |
| 4 | 2013 | 5,948 | 347 | 6,295 | 525 | 10.96 |
| 5 | 2014 | 7,740 | 477 | 8,218 | 685 | 29.32 |
| 6 | 2015 | 9,777 | 792 | 10,569 | 881 | 28.45 |
| 7 | 2016 | 11,589 | 1,081 | 12,670 | 1,056 | 19.64 |
| 8 | 2017 | 13,694 | 2,015 | 15,710 | 1,309 | 24.20 |
| 9 | 2018 | 16,089 | 2,923 | 19,013 | 1,584 | 21.21 |
| 10 | 2019 | 16,924 | 7,711 | 24,635 | 2,053 | 24.25 |
| 11 | 2020 | 19,446 | 9,613 | 29,059 | 2,422 | 21.37 |
| 12 | 2021 | 18,151 | 7,883 | 26,034 | 2,170 | -7.96 |
| 13 | 2022 | 23,999 | 8,763 | 32,763 | 2,730 | 25.85 |
| 14 | 2023 | 29,136 | 9,300 | 38,436 | 3,203 | 17.32 |
| 15 | 2024 | 29,905 | 12,336 | 42,241 | 3,520 | 9.90 |
| 16 | *2025 | 46,422 | 3,869 | 9.90 | ||
| 17 | *2026 | 55,351 | 4,613 | 19.23 |


