Everybody wants to get rich. Right?
To achieve wealth, one can construct an investment portfolio suited to their financial needs. But as a regular DIY investor, it is difficult to decide on which specific stock amongst the thousands of stocks you should start with, buy, or sell.
A stock screener is a tool that helps you narrow down your search to the right stock. It is used to filter the market for stocks that meet a given set of parameters.
Why Use A Stock Screener?
The purpose of a stock screener is to find stocks matching our criteria to build a watch list of stocks that interest your portfolio. It’s very time-consuming to go through a stock screener to pick a stock to buy every time.
The best approach is to use a stock screener to find stocks worth watching and you put them on your portfolio watch list. While you can start your stock watch list by using the S&P500 Dividend Aristocrats, Canadian Dividend Aristocrats, or Canadian Dividend Achievers, you may not want them all on your list and narrow down the companies that work for your strategy.
In your quest to find a screener, you will find free and limited screeners and paid screeners that can help you with unique data. You might be against paying, but you won’t find any free screeners with access to data that you really need to find great stocks.
How To Use a Stock Screener
A good stock screener is useful in constructing a stock watch list to build a successful investment portfolio. An ideal stock screener provides features such as:
- Ease of Use
- Quality of Data
A good stock screener will guide you toward the stocks based on your requirements and investment needs. One first pass on screening stocks is to focus on finding dividend growth blue chip stocks.
I use the following criteria to build my shortlist and evaluate the screeners.
- Screener Criteria 1: Stock Market is the TSE (Toronto Stock Exchange)
- Screener Criteria 2: Market Capitalization above $2B
- Screener Criteria 3: Dividend Yield above 0.5%
- Screener Criteria 4: 5 Year Dividend Growth rate above 5%
You will notice the criteria are not strict, and it’s to avoid filtering out hidden opportunities. If you go too high with the dividend yield, you lose on stocks like Canadian National Railway or Alimentation Couche-Tard.
Being strict comes when it’s time to pick a stock from your shortlist and review the finer details of the financials.
Basic filters on market capitalization, yield, and PE ratio are usually free of charge, but other metrics will push you toward a paid option. Most screeners will also try to apply their own scoring method for rating a stock, and none will match across screeners, so you need to find what resonates for you.
Selecting Stock Filters
This is a bit of an art. Let’s be realistic that you need to understand the nature of the company’s operating cash flow to know how to filter properly.
Some of the basic data points screened for are often the P/E ratio or the dividend yield.
The Chowder Score is a critical filter for dividend investors, and some will enjoy the Graham number or the Piotroski F-score. The RSI (Relative Strength Index) can also be filtered against as a tiebreaker if you want to consider the timing.
Stock Screeners Available
This list might not be exhaustive and was compiled keeping in mind the most commonly used parameters. There might be more stock screeners available for Canadian stocks.
Selecting a stock screener is just taking the first step toward creating your portfolio. Once that is done, research about the company’s fundamentals and plans is required.
I hope this list was helpful to you. Good luck, and happy investing!
| Rank | Screener | Free | Paid |
|---|---|---|---|
| 1 | Dividend Snapshot Screeners | No | Yes |
| 2 | Stock Rover | No | Yes |
| 3 | Investing.com | Yes | Yes |
| 4 | TMX Screener | Yes | No |
| 5 | Globe & Mail Stock Screener | Yes | Yes |
| 6 | Barchart | Yes | Yes |
| 7 | Finviz | Yes | Yes |
| 8 | MSN Money | Yes | No |
| 9 | Yahoo Finance | Yes | No |
| 10 | Reuters | Yes | Yes |
What I have found in my years of investing is that none of the free screeners are good enough for serious investors! Go with the mindset that you will have to pay to get access to serious data.
Stock Screeners Review
Dividend Snapshot Screeners
The Dividend Snapshot Screeners are very specific for dividend investors looking for dividend growth or dividend income.
Due to the sheer amount of metrics available, the screeners use Excel as it is significantly harder to use a website or your phone to screen stocks. Screen real estate is important.
The unique part of these screeners is the proprietary dividend data metrics for classifying stocks into dividend growth, dividend income, or both (the holy grail of stocks).
The usability is simple since you are using Excel, and you can filter at the top. A user interface most other web-based screeners have difficulty with.
Stock Rover
While I tried to screen stocks with a free screener for the longest time, it’s just not possible to get the data you need in the long run. The free data just isn’t enough. I have personally settled on Stock Rover as the best screener.
Below, you can see how easy it is to use, and above all, you get access to hundreds of metrics. Not only that, you can make your metrics from existing metrics and screen using your own custom metrics.
Investing.com
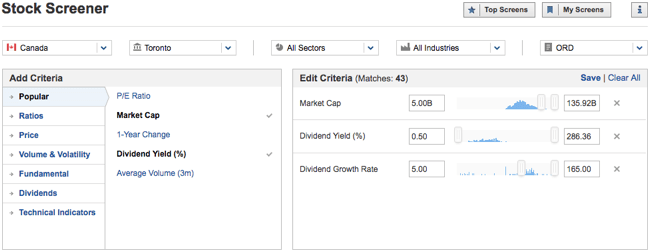
Investing.com helps you narrow down your search based on markets, exchanges, sectors, industries, types of equities, etc.
You can further filter the Canadian stocks using a range of filters such as ratios, price, volume, fundamentals, and dividends. Other than these, a host of technical indicators, such as ADX, ATR, Bull/ bear power, CCI, MACD, RSI, etc, are also available.
Each of these filters has several headers to choose from. Once sorted, you can save your screen by signing up for free. Another feature of this screener is its “top screens” – a feature very useful for a new investor.
A few of the top screens are “dividend payers with cheap stocks, fast-growing companies, or stocks on the verge of a breakout or heading for a fall” etc.
With 62 data points to create a screener, you have plenty of data to get started.
When it comes to the earnings calendar, investing.com has the best filter and navigation. It’s not part of stock screening but I wanted to pass along this information.
The user interface is by far one of the best and most intuitive.
TMX Stock screener
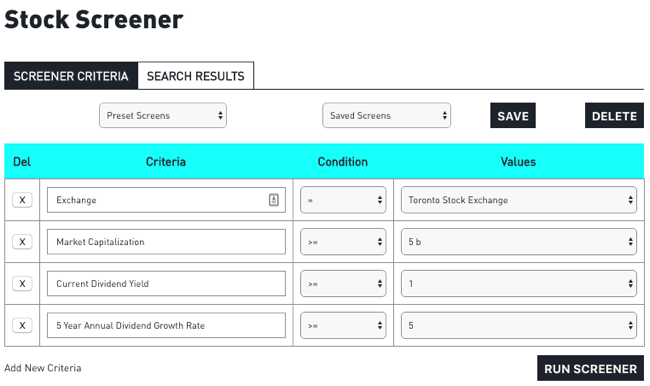
TMX Stock Screener is one of the most sophisticated Canadian stock screeners with a clear and comprehensive layout. And the good news is that it is free! Offered by TMX Group which owns the Toronto Stock Exchange, you can run a preset screener or a previously saved screener.
There are fundamental, technical, and descriptive metrics available to screen from. Other than the set seven basic criteria, you can add a few other filters related to dividends, share performance, financials, technicals etc. It is very user-friendly.
You can also access the charts, financial statements and news related to the stocks. TMX stock screener is a valuable tool for day traders as well, who can set and save stock price movements.
TMX is also a good tool for screening dividend stocks as it gives a wide range of filters to choose from such as dividend yield, payout ratio and dividend rate.
Over 76 metrics can be used to search and based on the criteria above 42 stocks were filtered.
Globe & Mail Stock Screener
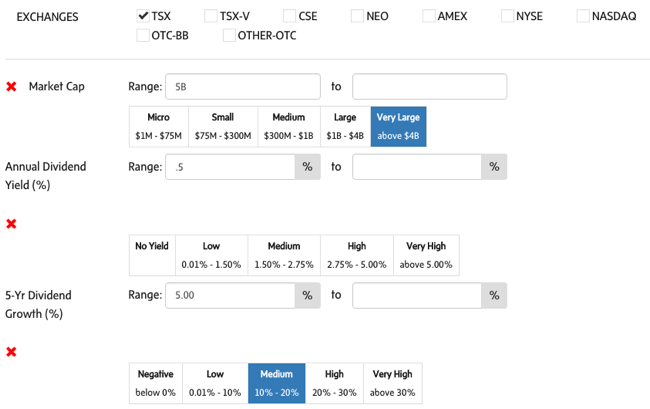
The Globe & Mail stock screener is maintained by the leading Canadian Daily, Globe & Mail. You can choose from several filters like the price quote, fundamentals, per share info, ratios and financials.
The 5-year dividend growth (%), a popular metric amongst dividend growth investors can be found here. All these features come for free while the advanced version has more parameters and filters to choose from.
66 metrics are available for filtering stocks. Using the same criteria as above, 37 stocks were filtered. Much of it can be attributed to the source of data based on my experience with different data providers and calculations.
Barchart
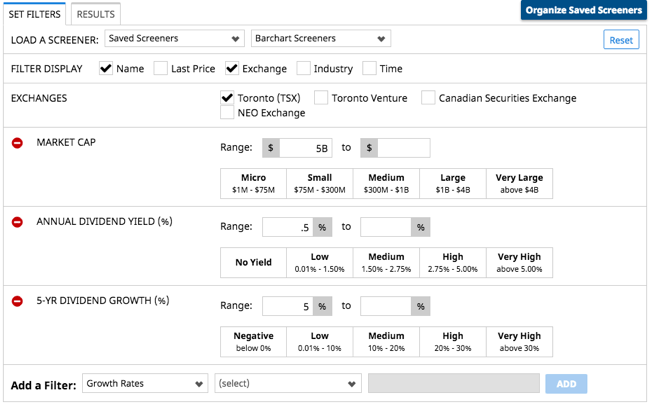
Barchart provides screener results for some countries like the USA, Canada, the UK and Australia. In the Canadian market, TSX, Toronto Venture, CSE and NEO exchanges are available. You can save your screen to be run on a later date. One can choose between many parameters such as prices, fundamentals, growth rates, per-share info, financial ratios etc. It is pretty much the same as the Globe & Mail stock screener.
If you are familiar with the Globe & Mail screener, you will notice the familiarities. That’s due to the Globe & Mail using Barchart’s technology to provide the service. Barchart is the official source of data and tools for the Globe & Mail for screening.
The biggest difference between the Globe & Mail and Barchart is the account requirements. I did not need an account with the Globe & Mail but I needed an account with Barchart. I am giving Barchart the nudge over the Globe&Mail simply because it’s focused on data and they have good visualization on sector movement and other data points.
Finviz
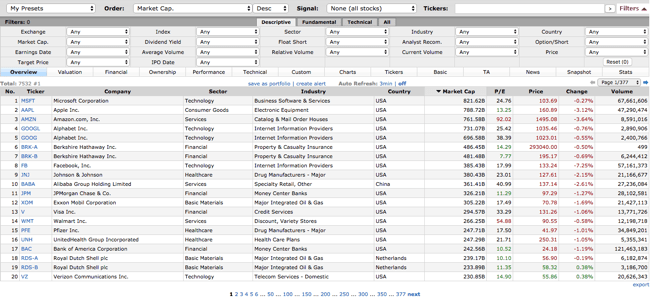
Finviz gives a lot of details in one screener and is useful for creating financial visualizations. You can choose between descriptive (eg. market cap, sector, dividend yield, average volume etc.), fundamental (P/E, ROE, EPS, growth etc.), and technical (moving average, volatility, performance etc.) filters.
Popular among both professional traders and investors alike, Finviz also gives details related to a stock’s ownership, valuation, financial, snapshot, news, stats etc. It also has a paid version.
An investor can look at the stock movement in his portfolio by day, week, month, quarter, year etc. This is one of the coolest features of the Finviz screener.
In addition to the above parameters, this stock screener also offers unique filters such as analyst recommendations, insider and institutional transactions, EPS growth this year, quarter-on-quarter, next year, next five years etc.
Finviz unfortunately disappoints dividend investors. It’s more of a trader’s screener and it doesn’t support stock exchanges outside of the US.
MSN Money
MSN Money makes available preset screens like “high dividend yields, bargain stocks, blue chips, 52-week highs and lows, tech giants” etc. If an investor is looking for a particular selection, he can simply click and get a list of stocks and their corresponding market capitalization values, dividend yield, ROE and sectors.
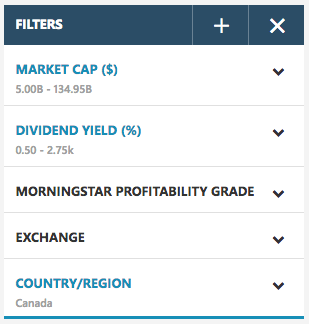
Alternatively, an investor can create his portfolio using filters such as key stats, price, growth, financial health, profitability, ratios, estimates etc. You can also use analyst ratings and Morningstar grades to further narrow down your search.
No dividend growth is present in the filter even with 66 data points available for users to screen stocks.
Yahoo Screener
Yahoo Finance also offers a Canadian stock screener with a huge choice of filters ranging from share statistics, income, valuation measures, cash flow statements, earnings, sector and other financial highlights. Yahoo Finance screener also lists out ESG scores for environment lovers.
However, this screener does not have dividend filters, so it might not be useful for dividend growth investors. You can also save the filters for future use view results in a list form or a heatmap view.

Reuters Stock Screener
The Reuters screener gives an option of choosing from a few saved quick screeners such as “growth at a reasonable price, large cap and small cap growth, near price highs” etc.
These screeners come with preset screen criteria suitable for the particular screener. You can define the range and play within the saved screeners, but cannot choose a new screener.
