The S&P 500 Index ETF, or VFV ETF for short, is a US-equity ETF. It seeks to replicate the performance of the S&P 500 Index and tracks the performance of large-capitalization U.S. stocks
It is un-hedged as opposed to VSP which is hedged to the Canadian dollars. Both trade in Canadian dollars but the VSP ETF will have currency trading on top to counter-balance the currency exchange.
Should you hedge or un-hedge the S&P500 ETF? It’s a question everyone ask and it’s not clear if one is better then the other but a great explanation of the complexity and benefits can be found at PWL Capital.
Pros of Vanguard VFV ETF
- Passively managed portfolio
- Low-cost ETF with an MER of just 0.08%.
- Uses efficient, cost effective index management techniques.
- It invests in ~507 U.S. stocks with a median market cap value of over $232 billion.
Cons of Vanguard VFV ETF
- 100% Equity, could be volatile
- No international exposure. The fund invests 100% in the USA.
Vanguard VFV ETF Facts
- Inception Date: November 2, 2012
- Benchmark: S&P 500 Index
- Net Assets: $4,663M
- MER: 0.08%
- Distribution Yield: 1.12%
- Dividend Schedule: Quarterly
Vanguard VFV ETF MER – Management Expense Ratio
VFV’s management fee stands at 0.08% and MER is 0.08% which is much cheaper than robo-advisors. VSP that tracks the same stocks as VFV but is CAD-hedged and has a 0.09% MER.
The MER is what Vanguard takes to manage the fund for you. It’s much cheaper than mutual funds and in some cases cheaper than investing on your own.
Mutual funds can charge over 2% and it robs you of your returns. It’s time to ditch your mutual funds and switch to ETF ASAP. Many brokers such as Questrade offer free ETFs. Couple the free ETFs with low MER and you are ahead of many.
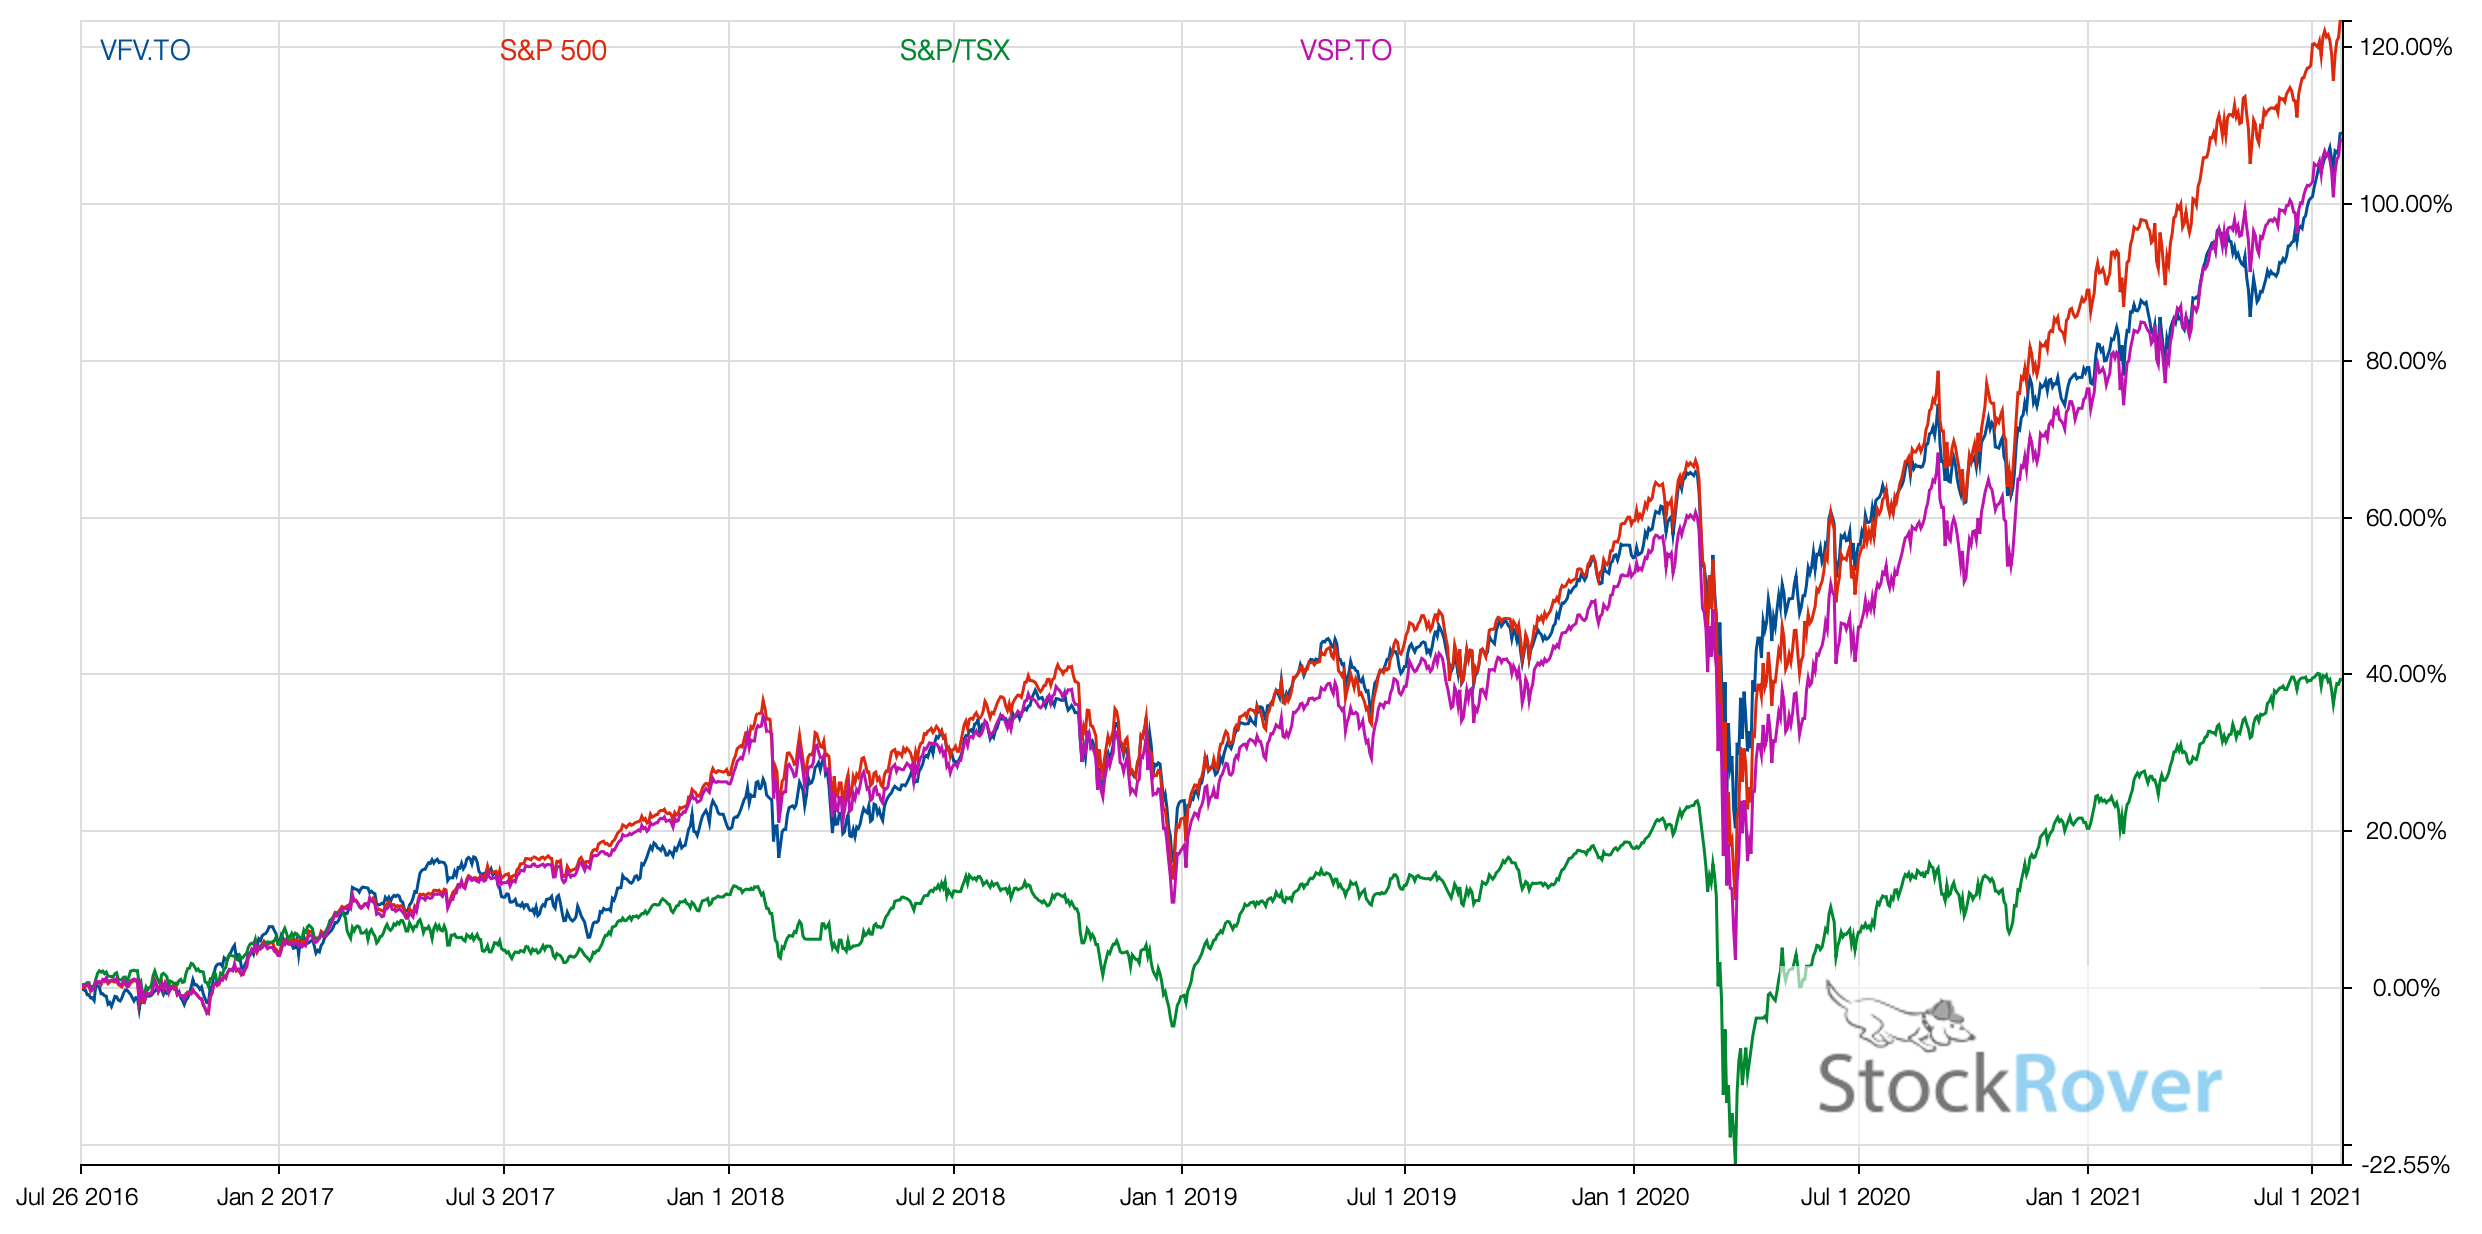
Vanguard VFV ETF Performance
The annual rate of return for Vanguard VFV ETF since inception is more than 18%. Its performance has been in line with the broader S&P500 index in the last five years.
Investing in the S&P500 is simple and works. The only question is whether you hedge or not.
The debare over CAD-Hedged or not is out there and most of it is based on your understanding and expectation of the USD currency. It’s not worth fussing over it in my opinion.
Take your TFSA account as an example. The rules are the same for everyone and I mean everyone. The growth is ultimately a factor of your investment performance provided you make your TFSA contribution limit every year. The annual performance of an ETF matters as you can see below the growth over 20+ years.
Vanguard VFV ETF Holdings
VFV is a pure stock-based fund, in sharp contrast to Vanguard’s VGRO and iShares XGRO that have 80% equity and 20% fixed income assets. The portfolio asset mix may be reconstituted and rebalanced from time to time at the discretion of the sub-advisor.
About 82% of the fund’s allocation is towards large-cap stocks, followed by 12% in medium-cap stocks. The balance (~6%) is in medium to large and medium- to small-cap U.S. stocks.
VFV’s top investments include Apple Inc, Microsoft Corp., Facebook Inc., Alphabet Inc., Berkshire Hathaway, Tesla, NVIDIA Corp., and JP Morgan & Chase & Co. as of June 2021.
| wdt_ID | Sector | Ratio |
|---|---|---|
| 1 | Financials | 11.30 |
| 2 | Utilities | 2.40 |
| 3 | Communication Services | 11.10 |
| 4 | Consumer Cyclical | 12.30 |
| 5 | Energy | 2.80 |
| 6 | Basic Materials | 2.60 |
| 7 | ||
| 8 | Industrials | 8.50 |
| 9 | Consumer Defensive | 5.90 |
| 10 | Real Estate | 2.60 |
| 11 | Cash | 0.00 |
| 12 | Technology | 27.40 |
| 13 | Healthcare | 13.00 |
Why hold Vanguard VFV ETF
VFV ETF is a good way for Canadian investors to diversify their holdings and gain exposure to some of the most popular blue-chip companies.
It provides exposure to large US stocks specifically inclined towards IT, healthcare, consumer discretionary, and financial sectors. The ETF entails a medium level of risk and is suitable for investors seeking long-term capital growth and do not mind stock market volatility.
Consider that the S&P500 companies are all operating in many countries and countributing to the global economy. It’s like investing in the world.
If you want the dividends, it’s not clear you will get the same growth but the the best banks and the best utility stocks will give you more income.