Tracking your portfolio performance is a really important step to successful investing. If you don’t know how your portfolio is doing, you won’t know if you are making the right decisions.
Chances are that you are here to get a free portfolio spreadsheet and you are almost there. With a few spreadsheet tips, you’ll be on your merry way.
The Way Money Flows
If you can’t evaluate your investment decisions, you will go in a circle and realize years later that your portfolio is not growing as it should. It can lead to drastic investment decisions to recover time lost … We don’t want that. A portfolio & dividend tracker can help assess the income gap in your retirement and allow you to take appropriate action.
Here is a simple view of how money flows when investing. Are you asking yourself those questions? Are you able to answer them?
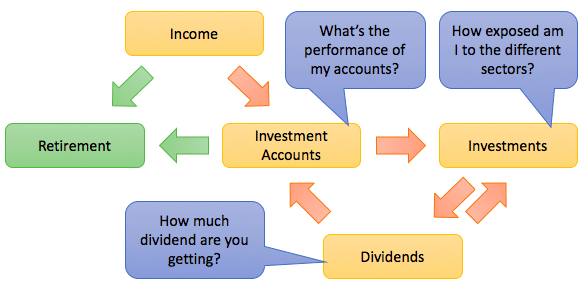
You also need to know what’s in your portfolio and what it means to your performance, such as your exposure to the different sectors or the dividend income your investments bring in. With respect to planning for retirement, you certainly want to know how much dividend you can earn in a year or by the month. The dividend income should grow, and you can then forecast how much to save and invest to reach your goals. Whether your portfolio can keep up with inflation is a critical question you must also be aware of.
As you can see, it all works together, but it’s not easy to set up properly to answer all of those questions. You need to use Google Sheets (Excel or any other spreadsheet can also work) and understand how to look up data in other sheets.
Fear not, below are the steps to do it yourself for your free dividend tracker or you can save the time and get the Dividend Snapshot Tracker all setup and ready to go. You can have your personal dividend calculator and make it the best portfolio tracker!
TIP: Google Sheet is the best spreadsheet to use to track your portfolio. Go ahead a create a Google Sheet using your gmail account. You do have a gmail account right?
TIP: Learn about setting up drop-down selection as well.
Build Your Free Portfolio Tracker
Before we dive through the steps to build your portfolio tracker, we need to discuss some necessary spreadsheet skills and the status of quotes retrieved online.
The Yahoo Finance API (Application Program Interface) was used to allow fetching of the stock quote, but it has been deprecated for use outside of their website. Google Sheet, with the GoogleFinance API, is now the only spreadsheet capable of fetching quotes. Excel is manual or requires add-ins.
If you go down the manual route, getting a stock quote can be done through Google Finance, Yahoo Finance, Morningstar or your discount broker. Your discount broker is probably best as you have all your holdings in one location (or a few if you have multiple accounts).
Note that Google Finance changed its portfolio management, and I have researched alternatives to Google Finance, with MSN Money leading as the alternative.
IMPORTANT – Very few services can reliably pull quotes for spreadsheets since Yahoo deprecated their web API. You either need to use Google Sheets with the GoogleFinance function or enter the stock price manually.
Step 1 – Stock Reference List
The first step is to itemize your holdings and the details pertinent for reporting. You can track more information, such as the industry, international exposure, and growth vs income investment. It’s really up to you to track what you want. The information entered here can be looked up in the other tabs (note that the second row, hidden in the image, is a column number starting with 0 to facilitate lookups).
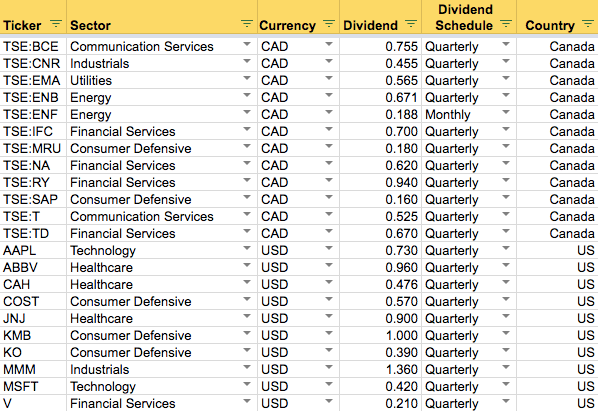
TIP: Since we, investors, often hold the same stock across multiple accounts, a master list of holdings is easier to maintain. Set it up so it has all the information you need about each investment. The image shows an example but you can have mode details if yout want. You want to pull the stock quote here with =GoogleFinance(A2) for example.
Step 2 – Setup Your Account Holdings
The stock details tab lists all of your holdings per account. The light grey cells can be automated through a formula or a lookup into another tab. The idea of using color coded cell is to quickly understand what can be changed vs what is computed for you.

The following columns are up to you to define, but I track, at a minimum, the following columns:
- The account the stock is held. I sometimes have the same stock in multiple accounts.
- The stock ticker (to reference the other tab).
- The sector, or industry, if you care about it.
- Total shares represent what your account has in total. You can manually enter it, or sum it from a transaction tab. It depends on the complexity and amount of details you want to track.
- The quote is retrieved from the other tab using a VLOOKUP function.
- Market value is the simple math of total shares multiplied by the quote.
- Primary currency value is where I multiply the market value by the CADUSD=X exchange rate where applicable. If the ticker ends in a “.TO”, then the exchange rate is applied.
- Dividend yield can be listed once you enter the dividend and you can track your yield on cost if that matters to you based on your average purchased cost.
You can then decide on the information you want on this tab. At a minimum, you have the current market value of your investment. The amount invested can tell you how your holdings are doing vs your purchase price, but it’s not a good performance metric.
The stock valuation is an important step in setting up your portfolio and dividend tracker to get an overall picture of your accounts. I prefer to look at the account performance rather than the individual stock performance. Otherwise, it becomes a stock-picking process, and you get into bad habits of trying to predict the performance of an individual stock.
After this step, you should have a second tab listing all of your stocks with all the columns you want per holding per account. The summary portfolio performance is optional at this point.
TIP: VLOOKUP are really important to understand. That’s what you use to reference cells in another sheet.
TIP: SUMIFS is another important function with spreadsheet that you need to know to sum data points together from another location by referencing data. In this case, the “Account” and the “Ticker”
Step 3 – Contribution & ROR Tracking
This is where the magic happens for my portfolio. I know exactly what the performance of my portfolio is.
As I have explained a number of times, the performance of your portfolio is a factor of your contributions to your accounts and your overall portfolio value. The individual stock transactions or holdings are not the focus, or the DRIP price, for that matter.
You need to track the money going in and out of the account versus the total value set up in the summary tab of Step 2 above. With that information, you have to apply the XIRR function, and you will have the ROR for your portfolio.
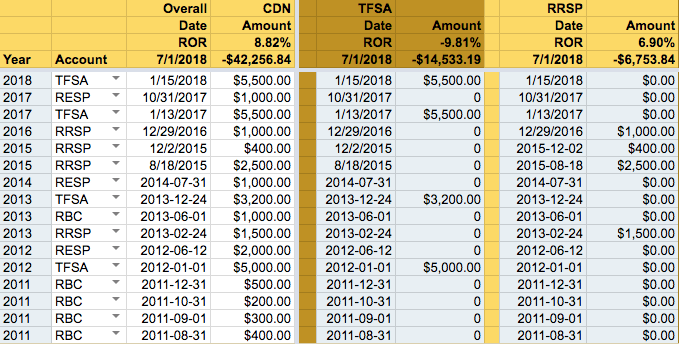
After this step, you should have your 3rd tab tracking all the money going in and out of each account. This is set up to use the XIRR function to calculate the annual rate of return.
Step 4 – Summary View
This is your landing page. This is the primary tab where all the information is put together.

The data points in the summary page are either referecing other tabs directly or doing a SUMIF.
Step 5 – Reporting & Sector Diversification
All you need to do is assign a sector and industry to your stock holdings, as seen above, and you can report on your sector exposure using the SUMIF function in Excel or Google Sheets. The target per sector is for you to identify based on your investment goals. Over time, you will see that sectors perform differently, and you can use that to decide which investment to add to. It took me a few years to adjust the target to what worked for me. Do a first pass and review it every quarter or year to see if it matches your investment philosophy.
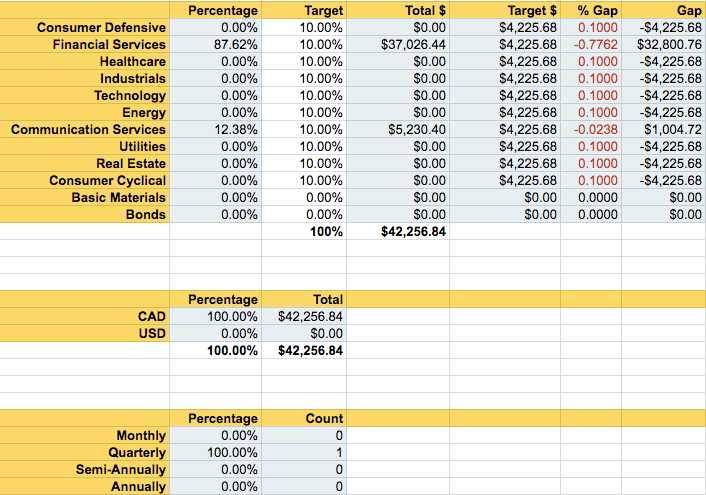
After this step, you should have a third tab summing up your holding value per sector if that’s of interest.
Step 6 – Transactions Tracking
You either want to track all of your transactions, or you want to track those in accounts where you need to pay taxes. Either way, it will take time on your part to track the BUY, SELL and DRIP.
This setup is critical if you have REITs as it allows you to easily track your return of capital to keep track of your share adjusted cost basis (ACB).

As seen above, all of the ‘light grey’ shaded cells are computed and white cells require information from your accounts. It’s all the information you need to track your capital gains. The following fields are needed for the capital gains tax calculation.
- Stock Ticker – To know which stock your transaction is for
- Trade Action – Is it an addition or a subtraction
- Shares – The number of shares you added or removed
- Quotes – The price of the stock at the time of the transaction
- Amount – This is just the share count multiplied by the price of the transaction
- Transaction Fee – That’s usually tax deductible; don’t forget it.
- Currency Exchange – Currency exchange needs to be considered for your transactions as profit from currency is taxable
Remember, you can hold those investments for years if not decades and it’s your responsibility to file the capital gains properly. The onus is, therefore, on you to stay on top of it.
After this step, you should have a 5th tab providing all the data necessary to calculate your capital gains if you want to track that.
Step 7 – Dividend Income Tracking
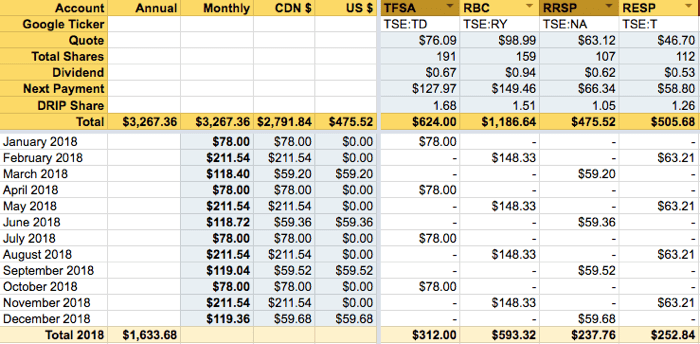
If one of your investment goals is to have your dividend income provided in retirement, tracking it is necessary. Otherwise, you won’t be able to extrapolate future income, especially once you stop adding investment money.
This is quite a bit of work as every month, and you need to update the dividend income for each stock paying for that month. The dividend rate may have changed so it needs to be looked up to keep it accurate.
The effort is worth it as you can holistically access your dividend history. You can also start breaking down which stocks contribute the most to your dividend income. If you choose to track your dividend income, you have a 6th tab to your spreadsheet.
The Google Portfolio Tracker
Google Sheets is now the best framework to build a portfolio or dividend tracker spreadsheet and see you value updated automatically. All other options are more complicated.
The good news is that for what you need, Google Sheets is as good as Excel. You can also use it on your phone easily – that’s a bonus.
They are the basic introduction to tracking capital gains and dividend income but it’s a good start depending on what you need.
One key point to be aware of is that Canadians usually deal with both USD and CAD dollars whereas Americans usually only have USD. It becomes important that USD stock holdings are converted to CAD dollars to establish the proper market value in the home currency. Google Sheets can automatically convert the currency as well.
Don’t forget to use the DLR Norbert’s Gambit to execute your currency conversion.
Dividend Snapshot Tracker
Google Sheets is the default for the Dividend Snapshot Tracker. If you choose to get the spreadsheet, all you need to do is enter the information needed:
- Accounts where you hold stocks
- Stock information such as sector and dividend (not automatic)
- All your transactions, such as buy, sell, div and DRIP
- Your contributions to your account to calculate your true rate of return
PORTFOLIO TRACKER
$39
Portfolio Performance
Dividend Income
Diversification Graph
Stock Exposure
Google Account
You end up with a proven and tested portfolio tracker with dividend history per stock, per month or annually.
Provided above is the step-by-step process to creating your tracker with examples and options to get you started. I spent over five years getting to this stage and refining my process for tracking all the details I need to make informed decisions.
The discount brokers I have used and Quicken have all failed to give me a clear picture of my performance until I got set up with this spreadsheet.
No excuses. Now you have it all available. With some minimal spreadsheet skills, you should know exactly what your rate of return is and be confident in making good portfolio decisions.
With all of the options offered above, there are no reasons not to have a dividend tracker and understand the performance of your portfolio.

