Understanding your rate of return (ROR) is critical to understand your portfolio performances. There are just too many ways to do math with stocks, but there is only one way to truly calculate the performance of a portfolio.
I have never been happy with Quicken’s ROR calculation and have always questioned the numbers. More importantly, how do you calculate an accurate rate of return with your shares re-invested?
I am sure there is a generally accepted accounting procedure for the ROR, and I know there is one from a tax perspective, but I have decided to follow the following rules:
- It’s based on the money I invest, not the shares I purchase. That means the math starts counting once I transfer cash into the account, not when I buy a stock.
- It’s based on the account’s value, including cash, and not the value of the shares. It’s the final number at the bottom of your statement.
- Stock investments, mutual funds or even GICs are investment vehicles to increase the portfolio’s overall value.
Rate of Return Variations
Assessing Your Profit
Let’s define how you assess your profit. I think it’s important to understand how to calculate your profit since it can be calculated differently, and the total value of your portfolio considers your profit.
Profits with GIC
profit = (principal + interest) – principal
The principal is your initial amount, and the interest is what you earn from your investments.
Profits with Stocks
profit = (principal + capital gains) – principal
The principal is your initial investment, and the capital gains are the profit (or loss) from your investment. The following formula defines your capital gain: shares count * (market value – purchase price). If you sold the stock, then it’s the selling price; otherwise, it’s a paper capital gain.
Profits with Dividend Stocks
profit = (principal + capital gains + dividends) – principal.
The same definition as above apply with the addition of the dividends you have earned.
- The principal would be the initial share purchase times the purchase price (excluding DRIP shares).
- The capital gains would be calculated with the initial share count as well.
- The dividends would be from the dividends earned (even if they are re-invested).
I kept this one for last as in a tax-free account, the gains are simple but in a non-registered account, you have to take into account the taxes you have to pay. I am, however, keeping it simple right now and disregarding the taxes.
A Simple Way To Get Your Rate Of Return
For the longest time, I thought I needed to track all my transactions to get an accurate picture and that’s a lot of work.
Let’s just be realistic. With dividends coming in every month and some of them with a DRIP, the accounting of every transaction across multiple accounts can become quite a chore. I already have to do that for tax purposes in non-registered accounts but it’s not something I want to do with all the accounts.
I needed to think about it differently and ignore the actual investments I have. It’s like a black box inside and I focus on the money I put in and how much it’s worth overall. Some of it is invested and some of it is in cash. All the matters are the following:
- When and how much is invested
- The total worth of the account
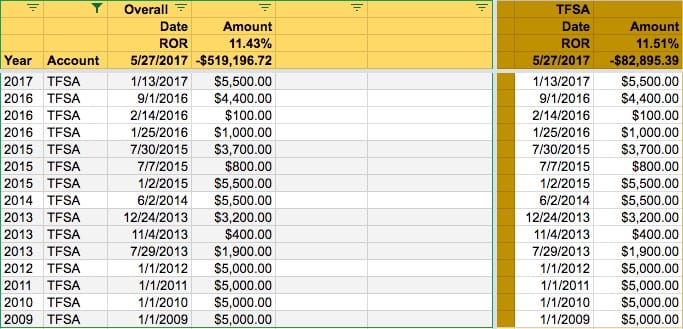
I decided to manage it by account but you could do it for your overall portfolio since you have the transactions for each account. The trick is simple as all you need to do is use the XIRR function of Excel or Google Spreadsheet. Let’s use the TFSA as an example since most will be familiar with the account. The total for the day is simply using today’s date and my total value of the account as a negative value. It has to be negative for the XIRR formula to work.

In the example above, I have an annualized return of 11.51% in my TFSA account. I hope to double the value within seven years and to do that; I need at least 10% annually when using the rule of 72.
If you withdraw from your TFSA, just enter it as a withdrawal with the appropriate transaction date, and your annualized return will adjust accordingly. What I have done is track the amount of money I put in the account as opposed to the individual investments, and it’s much simpler that way.
Step by Step Instructions
No matter what, pen and paper should be put aside in this digital age to use a spreadsheet. You can use Google Sheets or Excel and set up a comprehensive portfolio tracker with this post as a guide.
Your Trading Platform Rate of Return
Nowadays, trading platforms are required to provide investors with their annual rate of return based on the money-weighted formula.
This is what you see with ETFs when they show the rate of return from their ETFs. They don’t say it’s up 60% or 400%; they show the annual rate of return.

Why is that? It’s the one number that is comparing apples to apples. You can compare your portfolio to your neighbour, an ETF, or the stock market.
The annual rate of return with a money-weighted formula takes all the profits and time in the market into context and gives you your number. I personally like to focus on the “since inception” number.
Here is what RBC Direct Investing shows for my accounts (August 2022). You can group accounts all together. In this case, I exclude the RESP account.

The limitation of a return of return with a trading platform is that it excludes all your other accounts at other institutions.
