Shaking off decades of financial industry messaging isn’t easy. The ideas we’ve been fed—like the classic “hold your age in bonds” rule—can feel like gospel. But here’s the truth: that kind of advice might be doing more harm than good, especially today.
We’re living in a world where pensions are rare, inflation is sticky, and people are living longer. That “safe” bond-heavy portfolio might help you sleep at night, but it won’t grow your wealth. And let’s be honest—most of the messaging around that strategy is designed to sell you products, not help you reach your financial goals.
Bonds in the Indexing World
Now, if you’re an index investor, you might keep 5% in bonds. That’s fine—as a cash proxy. It gives you dry powder to rebalance quarterly and buy the index on dips. But don’t mistake that for downside protection. That’s strategy, not safety.
It’s a lot harder to execute this rebalancing with individual stocks. Most investors freeze during pullbacks, unsure which stocks to buy more of. With index ETFs, rebalancing is mechanical. Simple. Clean.
The Dividend Dream (and Why It’s Misleading)
Many Canadians dream of retiring on dividend income from blue-chip stocks. It feels comforting—those regular deposits, the consistent dividend hike. But here’s the hard truth: for most people, that path won’t get them to their goals.
Dividend income is seductive, but it often comes at the cost of total return. It might feel good to see that cash flow, but your portfolio might not be growing enough. You could easily index your portfolio now, build wealth, and shift into income-producing investments at 60. Have you ever considered that?
Let’s be real—many so-called “safe” dividend stocks haven’t delivered. Look at AQN, BCE, RCI.B. Dividend cuts, weak growth, or both. Some offer a good yield but no growth. Others offer growth but weak yield. You can’t have it all.
It’s All About the Math
Investing is just financial forecasting. If you invest $10,000 a year at 8%, you can calculate exactly when you’ll hit your financial independence number. But most people don’t want to look—because the truth hurts.
That’s why many shift to dividend income early. It feels like progress, but they’re ignoring the most important number: total return. See this TFSA chart for some pure math showing the reality of the numbers. You can choose to be happy with your returns based on your risk profile, but know your rate of return and acknowledge it for what it is.
Get Clear on Your Goals
Here’s the framework I use (and I encourage you to do the same):
- Pick a retirement age. It’s flexible, sure—but you need a target.
- Decide how much you’ll need annually. Is it $80K? $100K? Assume your kids are financially independent. You’ll need an average because you don’t need the same amount of money during the go-go, slow-go, and no-go years. Technically, you should forecast how much you need from 60 to 70, 70 to 80, and then 80 onwards. Your health plays a role in how much you need from an entertainment perspective.
- Figure out your savings capacity. Can you stash $10K a year? $20K? You may need to compromise or increase income.
- Run the numbers. Your return rate might not cut it. That means adjusting your savings or your timeline.
Don’t confuse wealth-building goals with retirement goals. They go together—but they’re not the same. Your financial life is like running a business. First, you grow it. Then you “sell” it and convert it to income.
Too many people start with the income part and never build the engine first. I made that mistake. Don’t repeat it.

Choosing the Right Products for the Right Investment Phase
Forget what the financial industry tells you. Their job is to sell you products. Your job is to understand your goals and pick tools that match them.
Here’s a breakdown of the popular products:
| Investment Products | Purpose | Complexity |
|---|---|---|
| GICs | Safety | Very Low |
| Bonds | Income with safety | Low |
| Bond ETFs | Income with safety | Low |
| Dividend Stocks – High Yield Low Growth | Income with growth | Low to Medium |
| Dividend Stocks – Low Yield High Growth | Growth with income | Low to Medium |
| Stocks | Growth | Medium |
| Canadian Depository Receipts (CDRs) | Growth | Medium |
| All-in-one ETFs | All options | Low |
| Index ETFs | Growth | Medium |
| Covered Call ETFs | Income with volatility | High |
| Max Yield ETF | High income with high volatility | High |
Know Your Portfolio Speed
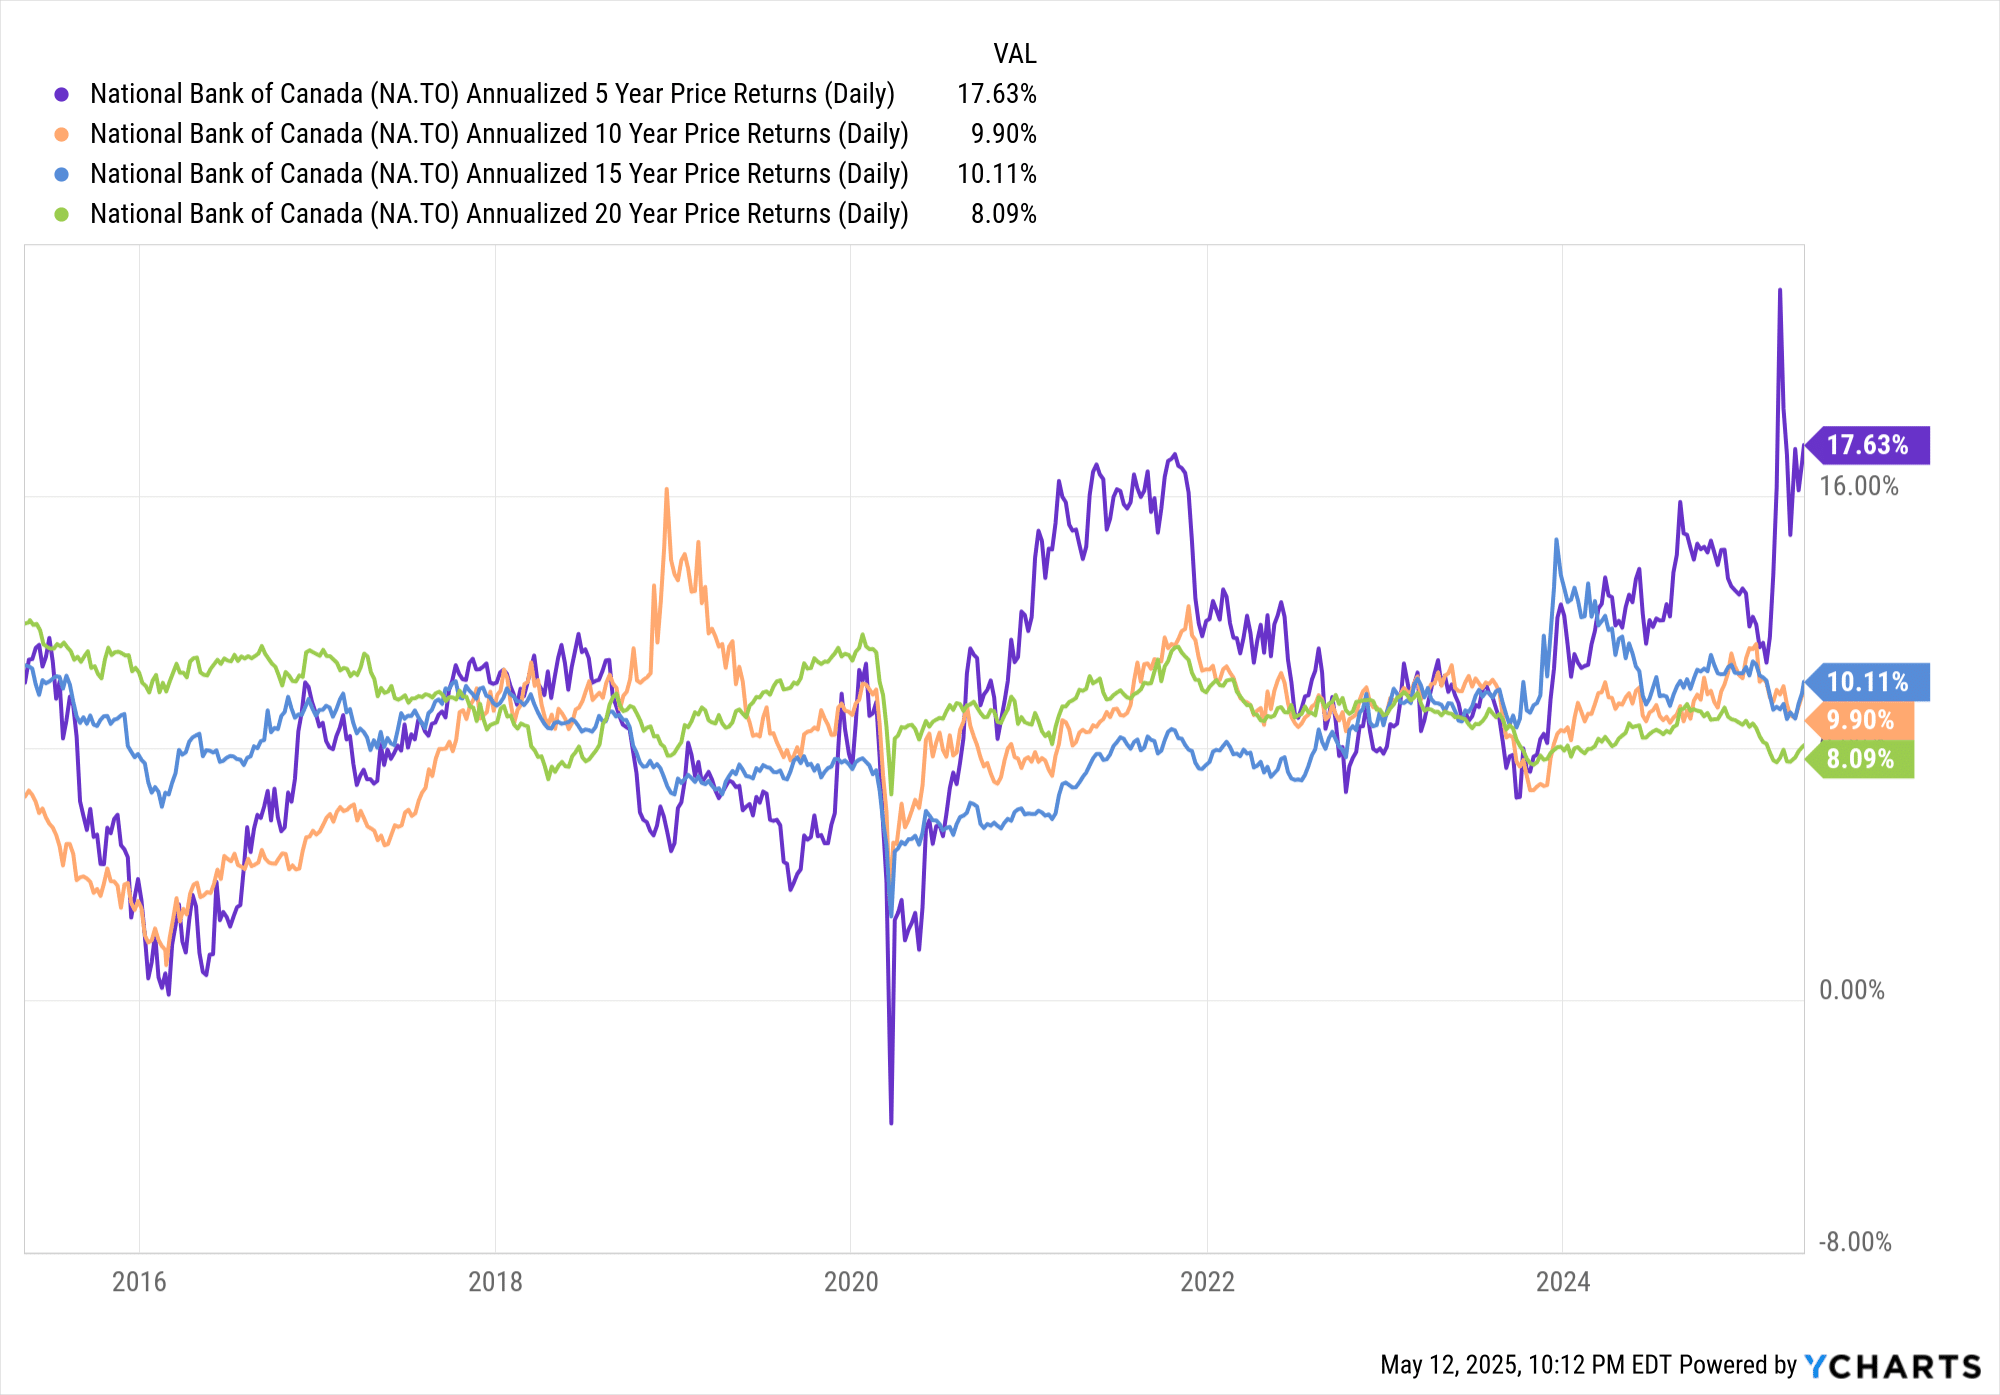
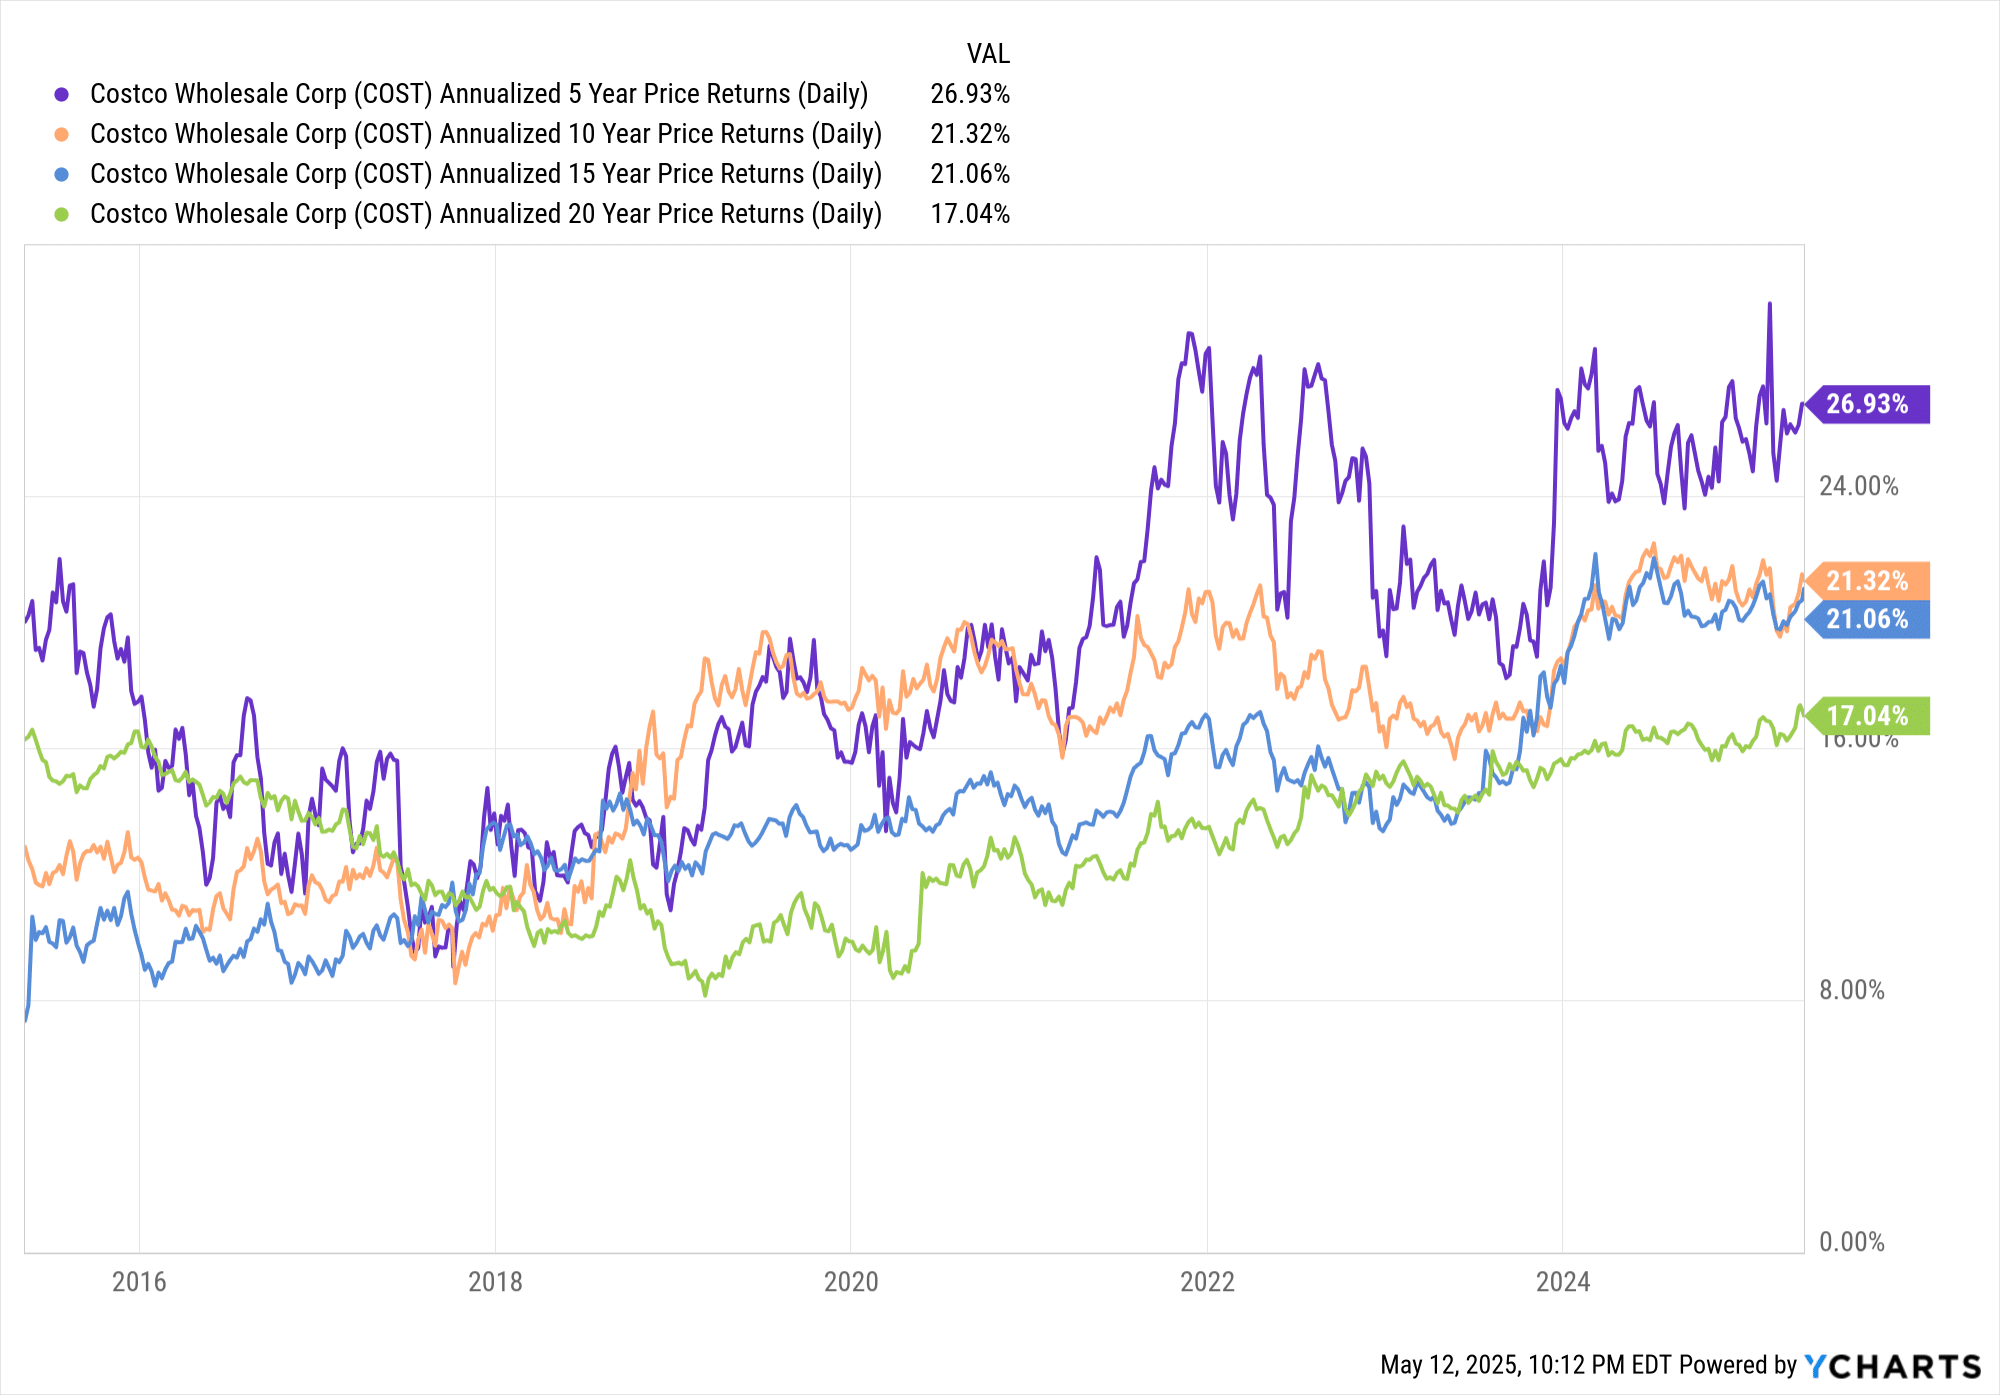
Want to know if you’re on track? Look at your annual rate of return—your portfolio’s speedometer. I always look at the 10-year return. Why? It typically captures both bull and bear markets, giving a truer picture.
Can’t find 10-year data? Make an educated guess. For example, if a fund has a 100% 5-year return, that’s about 14% per year using the Rule of 72. Quick math, big insight.
Here is an example with the popular VFV ETF.
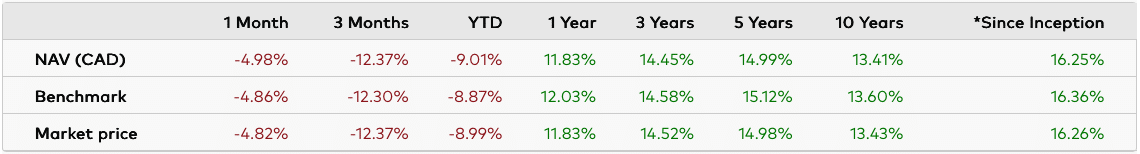
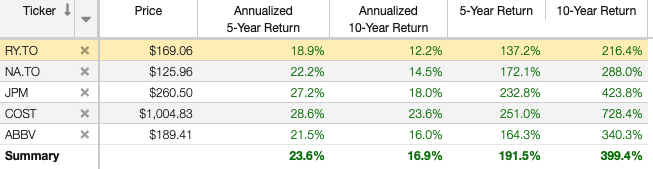
Here is how you can view the annualized rate of return with some of the screeners. I also like to quickly look at 5-Year Return and 10-Year Return as quick math with the Rule of 72 says that 100% 5-Year Return means a minimum of 14%.
Portfolio Growth vs Income
During the accumulation years, your annual rate of return is everything. It’s your compass. Your speedometer. Your reality check. It tells you if you’re actually on track to hit your financial goals—not just collecting dividends for the sake of it.
Dividend income feels good, sure. But it’s not the right metric when you’re trying to grow wealth. It’s like looking at the gas gauge instead of the speedometer when you’re trying to reach a destination. You might feel like you’re making progress—but are you?
Most trading platforms will show your account-level annual return—great starting point. But I take it a step further. I track the performance of each investment using a spreadsheet and the XIRR formula. It’s not complicated, and it gives you a clear picture of what’s actually working.
And honestly, when I ask investors what their annual return is, I usually get blank stares.
Think about that. If you’re driving and I ask how fast you’re going, would you shrug and say, “I don’t know”?
CAGR (Compound Annual Growth Rate) is your portfolio speed. If you don’t know it, you’re investing blind.
I wouldn’t be where I am without my spreadsheet. It started off as a simple dividend tracker, but over time it evolved into my investment dashboard. It tells me which investments are pulling their weight—and which need to be cut. Just like a coach benches a player who isn’t performing.
As for income? I use a simple 4% rule-of-thumb. Multiply your portfolio value by 4%, and you’ve got a rough idea of the income it could generate when you actually need it. Until then, focus on growing the pie—not slicing it up too early.
That’s why my focus is, and always will be, wealth building first. And it’s why I’ve added CDRs and Max Yield ETFs to my portfolio. Stick around—I’ll explain how they fit into the bigger picture.
Why I Hold CDRs
CDRs (Canadian Depositary Receipts) are one of the most underrated tools for Canadian investors looking to tap into the world’s largest economy—without the hassle of currency conversion.
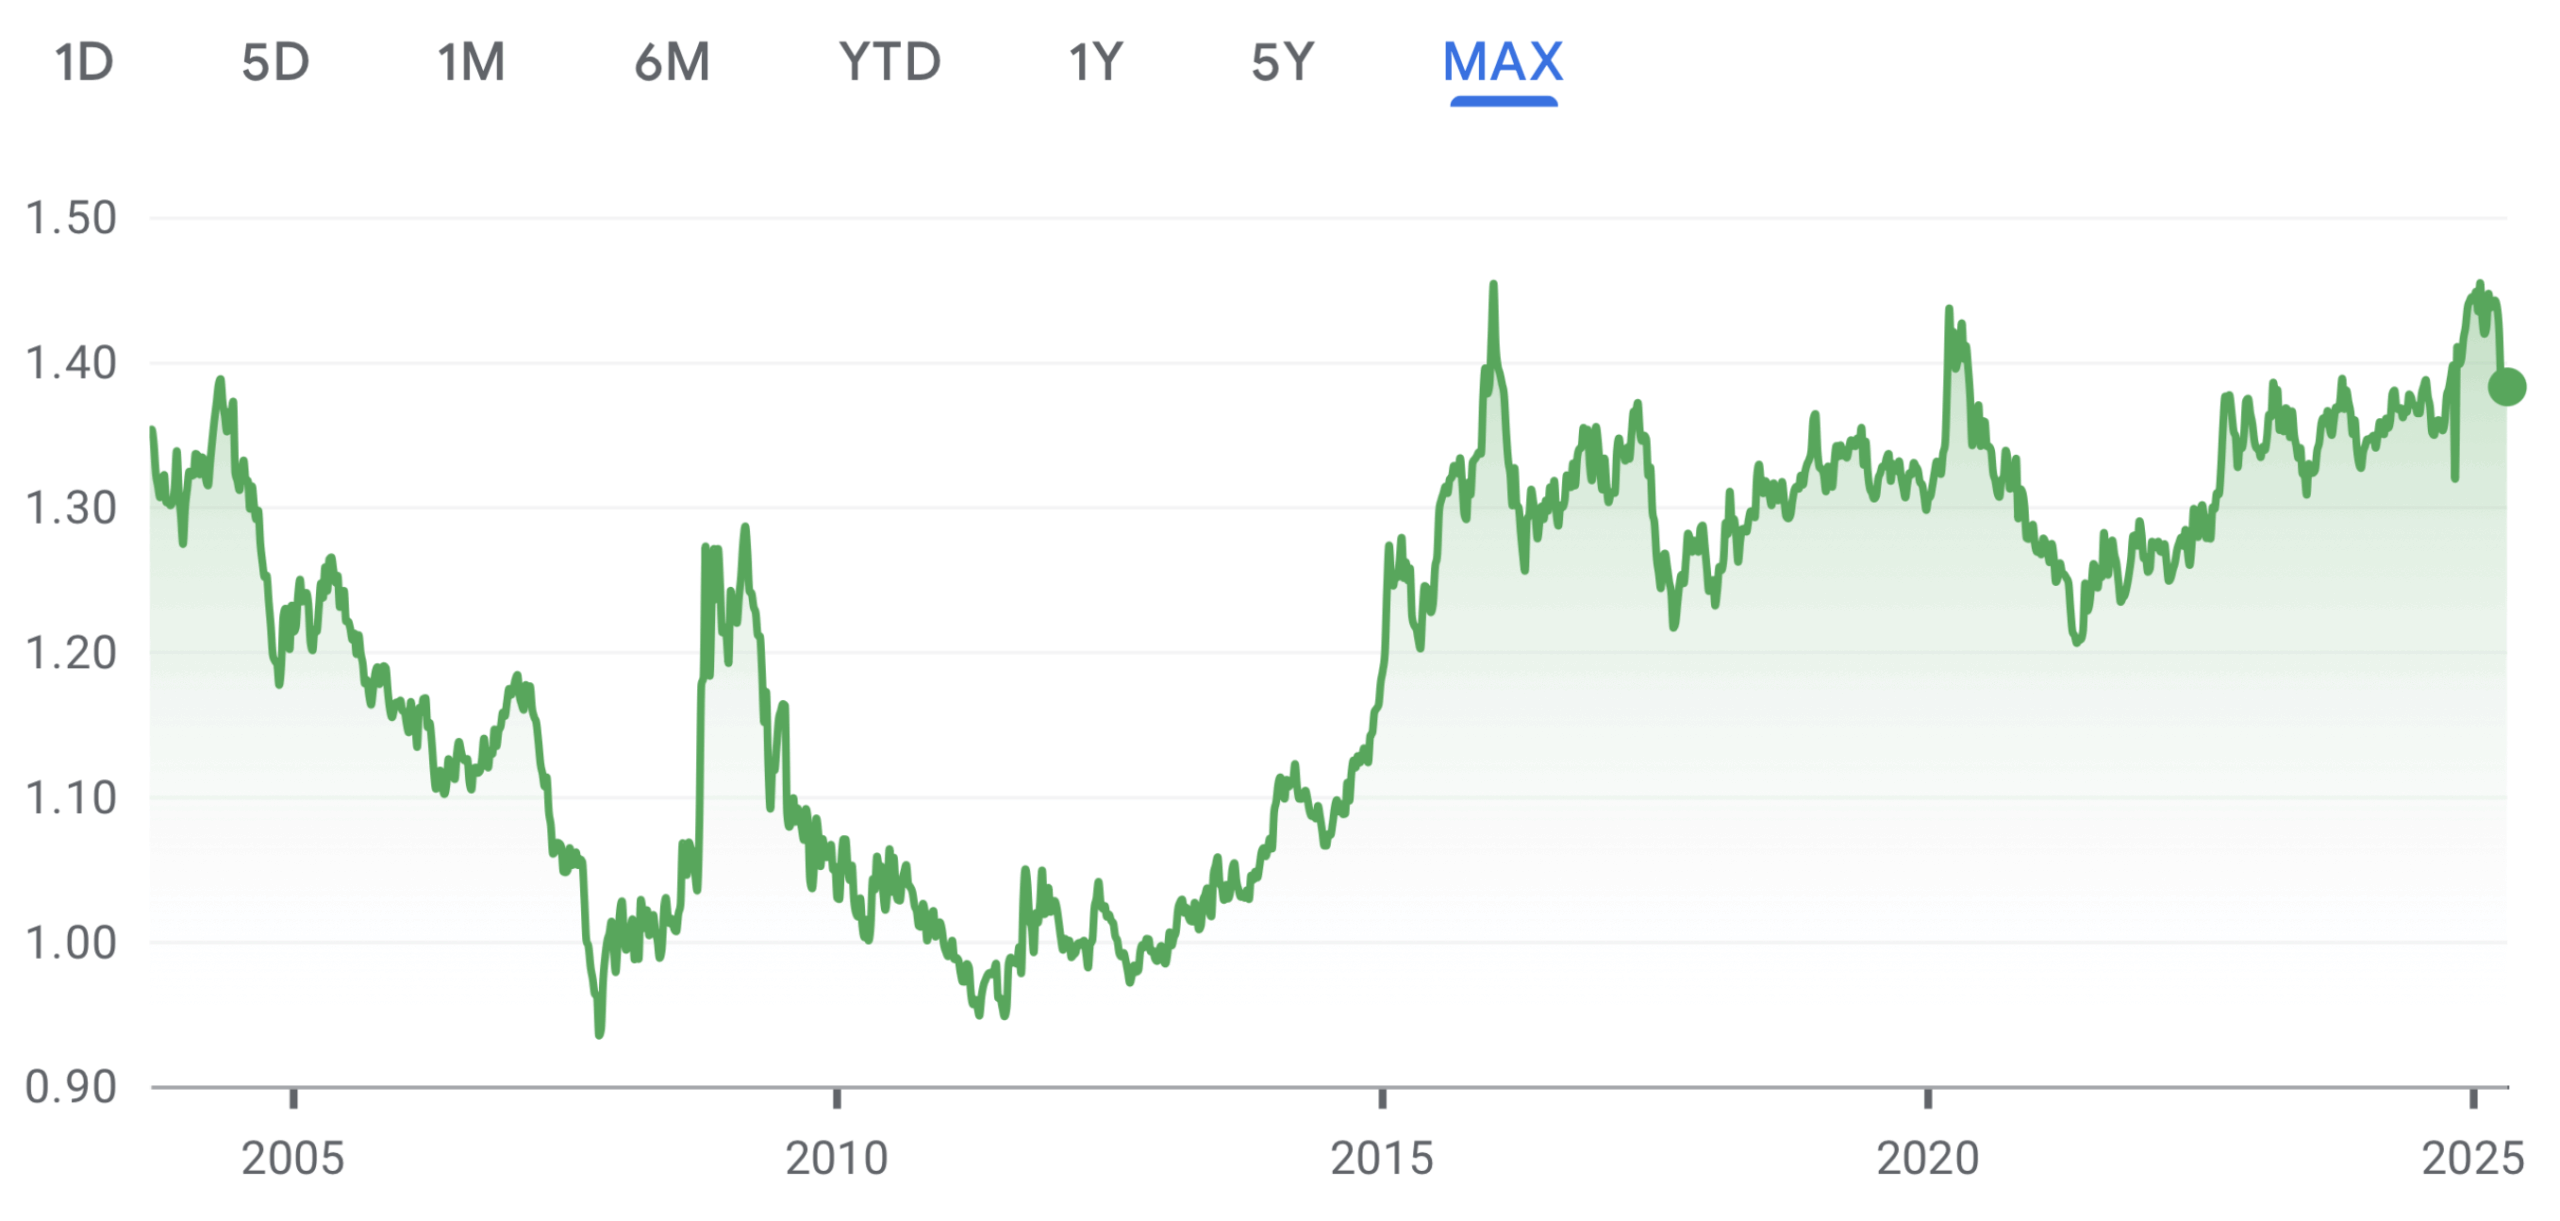
Let’s face it: investing in the U.S. market is essential if you’re serious about diversification and growth. But for many Canadians, currency exchange is a psychological and logistical roadblock. You’re not just picking a stock—you’re also trying to time the USD/CAD rate, and that added friction often holds people back.
That’s where CDRs come in.
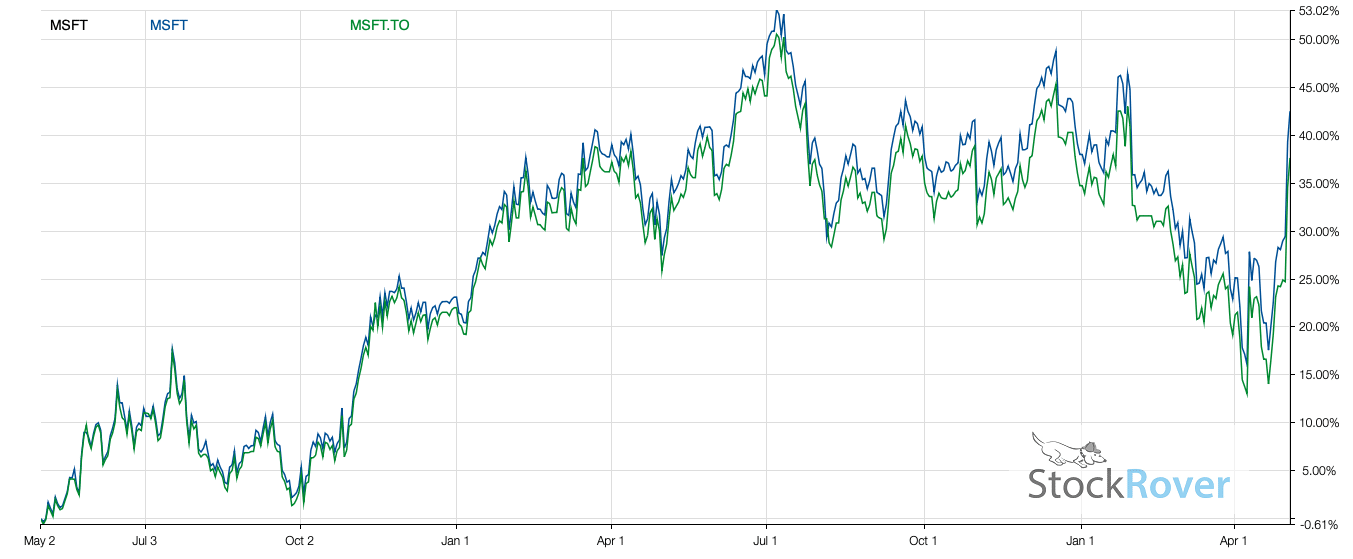
They allow you to buy fractional shares of U.S. mega-cap stocks—like Apple, Microsoft, or Google—in Canadian dollars, right on the TSX. Plus, they come currency-hedged, meaning you’re not exposed to the ups and downs of the USD. And all of that comes with a minimal cost—typically under 2%, which is about what you’d pay to convert currency anyway.
In short, CDRs let Canadian investors:
- Own U.S. blue-chip stocks without leaving the Canadian market
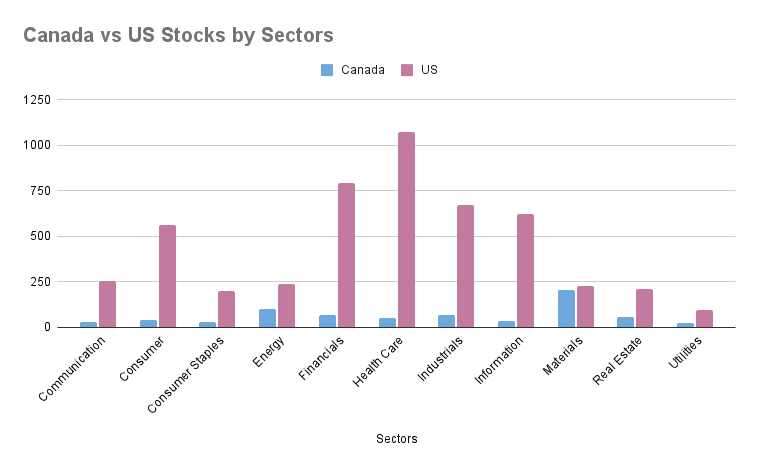
- Diversify beyond Canada’s limited sectors (looking at you, banks and pipelines)
- Avoid the complexity of currency fluctuations through currency hedging.
If you’re building a portfolio with individual stocks and want broad exposure without the FX drag, CDRs are a no-brainer. They’re one of the most efficient ways to buy global growth using local dollars.
Why I’m Experimenting with Max Yield ETFs
This might surprise some of you—but yes, I hold a Max Yield ETF.
If you’ve followed me for a while, you know I shifted my focus from pure dividend income to dividend growth and total return. Why? Because during the accumulation years, the number one goal is growing your portfolio, not just collecting income.
Some of my top-performing investments have delivered over 20% annualized returns for several years. So when I see an ETF with a 20%+ yield, I don’t dismiss it—I investigate. The question isn’t just “How much does it pay?” It’s “Can it help me grow my portfolio faster than other options?”
Now, I get it—these products come with risk. But risk often comes from not understanding what you own. Once you understand how a Max Yield ETF works—leverage, covered calls, concentrated exposure—the mystery fades. Then it’s just math.
Let’s not forget, many well-known dividend investors also run covered call strategies on the side. They might hold stocks like BCE or ENB and write calls to boost their yield from 4% to 6% or more. It’s a low-risk way to increase income when the stock isn’t going anywhere. That’s basically what these Max Yield ETFs do—just at scale, and often with leverage.
So, is borrowing risky? Sure. But so is not growing your portfolio fast enough. Many investors borrow to invest—it’s all about calculated risk.
Now, let’s address the elephant in the room: Is it too good to be true?
Maybe. These ETFs are still relatively new. There’s not enough long-term data to make definitive claims, and I wouldn’t call them core holdings. But I’m not here to guess—I’m here to track, measure, and learn.
Right now, I’m testing a Max Yield ETF in my taxable account, using the distributions to cover expenses. I got in below $20, rode it to $30, took my original capital off the table, and now I’m playing with house money. The income it generates is significant—and I’m still collecting data to evaluate if it deserves a bigger role in my portfolio.
If it works, great. If it doesn’t, I’ve learned something valuable—without risking my core portfolio.
I would not consider these products core and yet, I see many young investors on Blossom with a $300K portfolio and bragging about earning $60K in dividends. The only way to really know if it can grow your portfolio is to look at the rate of return which isn’t easy to come by …
Final Thoughts
Don’t let old-school thinking and financial product marketing hold you back. You need to build a portfolio that matches your goals—and that often means prioritizing growth over income in your early years.
Track your returns. Know your numbers. Treat your finances like a business. You don’t have to follow the herd. You just have to follow the math.